cbao
M
Posted 8 years 7 months ago
t
9 min read
Far too often we are puzzled as to how to best measure content success. So we look online. We ask around. And we find that not much practical advice is available. If you’ve encountered this roadblock, it means that you’re a good digital marketer. A good digital marketer doesn’t just create content; they hold each piece of content accountable for generating real business results. Fortunately, there is an easy-to-remember framework to measure content success. And I'm here to share the secret with you.
What is content marketing?
According to the Content Marketing Institute, “Content Marketing is a strategic marketing approach focused on creating and distributing valuable, relevant, and 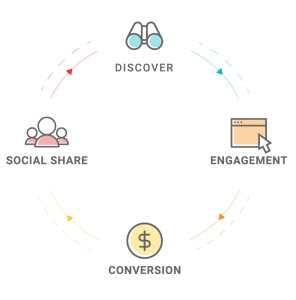 consistent content to attract and retain a clearly defined audience — and, ultimately, to drive profitable customer action.” Meanwhile, Content marketing and SEO are rapidly converging. This is great news for digital marketers. By closely aligning content marketing with SEO, your new content will be more easily discovered by search engines, and the results of its performance easier to measure. So, what’s the magic formula?
Content measurement starts with business goals
Remember how we created a brief for each new piece of content? In the content brief, we answered the question, “What is the business goal for this piece of content?” So, that specific goal you’ve set is where content marketing performance measurement begins. According to the B2B Marketing Report by Content Marketing Institute, marketers create new content to support the following business objectives.
- Lead Generation
- Brand Awareness
- Engagement
- Lead Nurturing
- Sales
- Customer Retention/Loyalty
- Subscription Growth
Do these reflect the goals supported by your content?
Measure content impact through a 4-step framework
Having identified your business goals, you can now dive deeper into the content marketing metrics that influence your content’s impact. For simplicity sake, let’s break these marketing metrics into four steps:
- Discovery
- Engagement
- Conversion
- Social Share
First, your content needs to be discoverable. If the content is pre-optimized by SEO best practices, its likelihood of discovery increases substantially. Then, the content needs to engage with the visitors that consume it. Internet visitors have a short attention span. If they don’t see relevant and valuable information within seconds, they leave your site. In order for your content to support your business goals, you need to build a trusting relationship with your visitor. To drive business results, any of your content will need to be measured by how well it can advance the reader further into the Buyer’s Journey. Use a Call-to-Action for each piece of content to guide them into establishing a deeper relationship with you and nurture them into a paying customer eventually. Lastly, don’t be shy with individuals who have interacted with your content and found it valuable. Ask them to advocate on your behalf. This is where social sharing comes into play. Now, let’s dig into the good stuff and this is place where an SEO platform, like BrightEdge helps you get ahead of the competition.
1. Determine if your content is discoverable
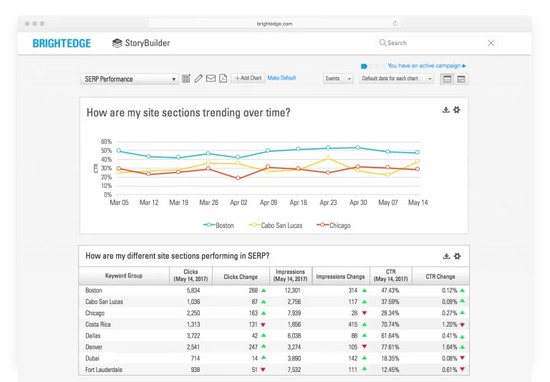
So, first off: Is your content discoverable without having spent a fortune in paid traffic acquisition? This potential is why marketers are latching onto the Content Marketing and SEO convergence trend. As you may know, utilizing SEO best practices will make your content ideation more effective. First, select content topics that are of high value: those that are both relevant to your target audience and have high monthly search volume. Then, use products like BrightEdge Data Cube and Share of Voice reports to view the topics your competitors are ranking high for, but you’re not. Furthermore, you can use BrightEdge Intent Signal dashboard to refine your optimization business plans by evaluating whether these keywords have any chance to achieve organic listings above the fold on SERP. So, what key content marketing metrics should you use to find out if your content is discoverable? They are Impressions, Clicks, Click-Through Rate (CTR), and site visitors.
- Impressions: How many times was your content visible on SERP? This metric helps you understand whether search engines find your content relevant to search keywords.
- Clicks: When your content was presented to search users, how often did they click to visit your site? This metric helps you understand how well your content resonates.
- CTR: Dividing total clicks by total impressions will give you CTR for a keyword or keyword group. Measure CTR over time for a piece of content to see if its resonance is improving, or benchmark it against your site average or competitors’ content to find out if it’s a top performer.
- Site Visitors: Once your content is discoverable by search engines and online search users clicked on your SERP listing, they become visitors to your site. You’ll want to ensure a consistent influx of new visitors, to grow the overall user base that you can nurture. But, make sure there is a healthy balance between new visitors and repeat visitors, which is appropriate for your business model.
Savvy SEO practitioners will notice I didn’t include Ranking in this metric set. The omission was intentional. Ranking is an intermediary factor to help you understand where your content shows up on the SERP. Ranking does you no good if it doesn’t convert to visitors. So, should you create a chart that shows Impressions, Clicks, and CTR at the keyword level? You can, but be cautious. Looking only at keyword-level data may introduce inaccuracy to your analysis. Sure, there should be just one primary keyword mapped to one piece of content. But remember, you normally have many keywords mapped to each piece of content. It is important to roll up keywords into sensible keyword groups and measure Impressions, Clicks, and CTR at the keyword group level for the content topics and site sections you care about most.
2. Ensure your content is engaging
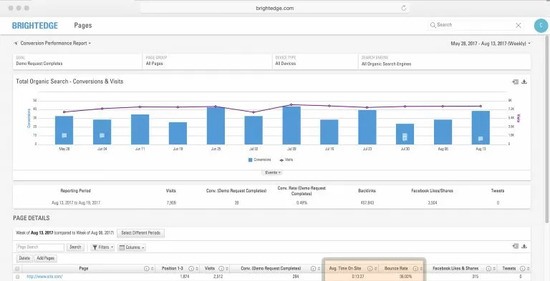
Once a visitor has clicked and arrived on your site, the “big show” starts. Your initial content page needs to do the heavy lifting to make sure the visitor remains interested and views additional pages within the same session. Metrics like Time on Page and Bounce Rates are two good starting points. For pages with low percentage of Exit Rates, Time on Page is a fairly good indicator of how long the visitor stayed on that page. If the Time on Page for a particular page is lower than your site average–and you are spending money to drive traffic to it–immediate attention is required. Bounce Rate is another good metric to watch. Bounce Rate means that a visitor entered your site via one page, and remained on this page, and remained on just this page for the entire session, with no clicks to other pages. Other than conversion form pages, such as “Contact Us” forms, most of your content pages should aim to reduce Bounce Rate.
3. Tie your content to conversions
So, your content is engaging. Visitors dwell on it. They click further into your site to interact with more content. And then they leave. Now what? Incorporating conversion actions will invite your visitors to permit you to engage with them further. Some conversions can be simple: “Sign up to our email newsletter” or “Complete the form to download this white paper.” Here are a few tips on how to align conversions to the buyer’s journey, and how to measure the results.
TOFU (Top-of-the-Funnel) content usually aims to create brand recognition and pique the interest of your prospect. Depending on the format of the contact, the call-to-action should aim at keeping them engaged. Where applicable, ask them to consume content that is deeper into the funnel. WhiteHat Security has a good example. whitehatsec.com has a section of content for Glossary, which is their TOFU content to educate prospects and increase engagement with the brand and its content. On each glossary page, such as the one for "path traversal", the WhiteHat team trickled in relevant internal links throughout the page. They also included a "soft CTA (call-to-action)" that encourages site visitors to sign up for their webinar about "path traversal".
MOFU (Middle-of-the-Funnel) content offers higher and more unique value to your prospects. Often, MOFU is where you start using soft conversions. Soft conversions are interactions where site visitors give you their names and email addresses. This information allows you to re-engage with them through emails. Increasingly, marketers are testing whether they should associate every piece of MOFU content with a soft conversion. My advice: test and iterate.
BOFU (Bottom-of-the-Funnel) content is where your conversion forms come into play. For some companies, BOFU could be the free trial version of a product. When a site visitor is in the BOFU stage, you’ve gotten their attention, received their contact information, have the name of their company, and perhaps understand some of their business objectives.You may also have their credit card information. Your priority for BOFU content is to give them a frictionless experience to complete that final leg of the transaction. Often dubbed as “hard conversion,” this could be a Free Trial form with credit card information saved on file or a Shopping Cart payment process. Remember: aim for higher conversion form completion rate.
So, how do you measure content performance throughout the funnel? First, track everything, including traffic sources and universal event tracking. Second, define conversion goals in your web analytics platforms. Then, assign an estimated dollar amount to each conversion goal. The more difficult the conversion, the higher the value. Run your analytics report to see which content pages or unique events convert better as measured by conversion rate for each conversion action. Over time, you will gain invaluable insights, such as:
- Which content pages are driving more conversions than others and why?
- Which content topics are driving more site revenue?
- What conversion action should you assign to each piece of content?
- What types of CTAs work best for each piece of content?
Learn more about optimizing content conversion by registering for our on-demand webinar, Beyond SEO: Connecting Content to Conversions.
4. Harness social sharing
Don’t forget social sharing. Social media sites are where online visitors “hang out,” whether they are B2C or B2B prospects. Getting shares for your content helps increase its visibility and can earn links for your site. Here are three ways to add social elements to your site:. Implement OpenGraph. It’s now a common methodology to increase social visibility and ensure a page renders properly on Facebook when it’s being shared. Most sites have Open Graph tags. Does yours?
Add social bookmarking to your blog. This helps visitors share the content they find useful in real time. Bookmarking creates good user experience and is an easy way to earn word-of-mouth marketing. Though it may not be obvious, think about social sharing when you create content. There is a lot of research (including this study by the New York Times) available about why people share on social networks. Motivations include adding value to their social circles, establishing who they are as a person, etc.
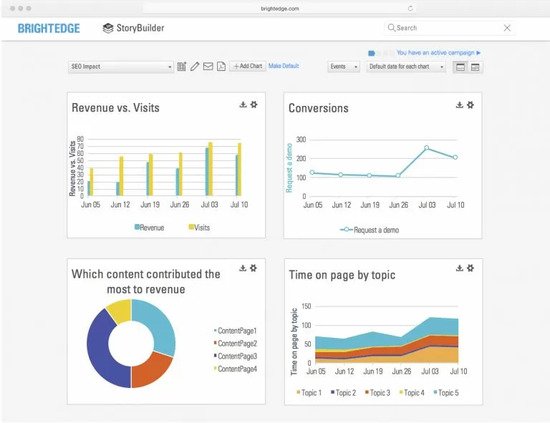
Leverage these insights, then consider whether each piece of new content feels “shareable.” If you have implemented social bookmarking widgets, reporting for social sharing activities is relatively easy. In the meantime, track each social sharing action as a unique event in your web analytics platform to see which pieces of content and topics have higher share rates than others. Once you have web analytics integrated with BrightEdge, you can create a StoryBuilder dashboard like the one below to evaluate and measure your content’s performance.
Conclusion
Content performance measurement for new content initiatives can be overwhelming. By applying this simple 4-step framework, you can create a content measurement framework that will help you fundamentally transform your content strategy and performance, maximizing your direct impact on revenue. Remember: Start to measure content success with business goals in mind. I hope you find these tips helpful.






 paid advertising.