
Google is rolling out the first phase of the new Google Search Console (GSC) Beta this week to all of its customers. Google says it will be releasing additional functionality and enhancements in the new GSC over the next rest of the year. For Google Webmaster Tools diehards, it will allow you to toggle back if you miss the interface or some of the coming-soon features. Here is the in-platform message that appears in the classic version:
- Search Console is introducing a redesigned product to help you manage your presence on Google Search. The new Search Console was rebuilt from the ground up to provide the tools and insights that site owners and SEOs have been asking for.
- You can now confirm which of your pages are indexed and get information on how to fix indexing errors. You can also monitor your performance on Google Search with 16 months of data (to enable year-over-year comparisons).
- We recommend checking your current status using the new Search Console today as we will only notify you if your site data changes from the current state.
The Webmaster Central Blog explains: "The functionality will include Search performance, Index Coverage, AMP status, and Job posting reports. We will send a message once your site is ready in the new Search Console."
Let’s dive in on new Google Search Console
The default view is Status, which looks pretty similar to classic GSC:
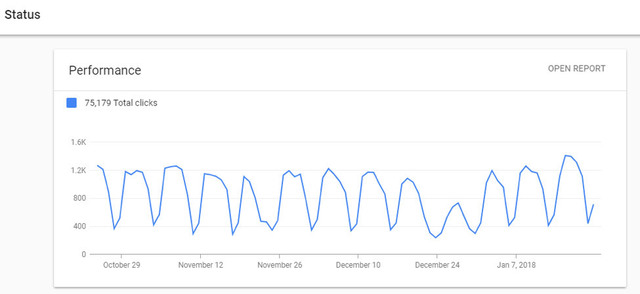
If you click on OPEN REPORT in the right, it gives you the additional controls of Result type, Country, Page, and Device.
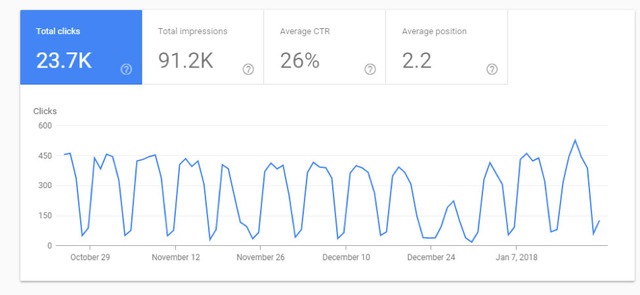
The controls are above the graph and allow you to visualize additional data. The Index Coverage reporting is below the Status and shows crawl errors in colors we have not seen in Google products before - Red for Errors and Yellow for warnings.
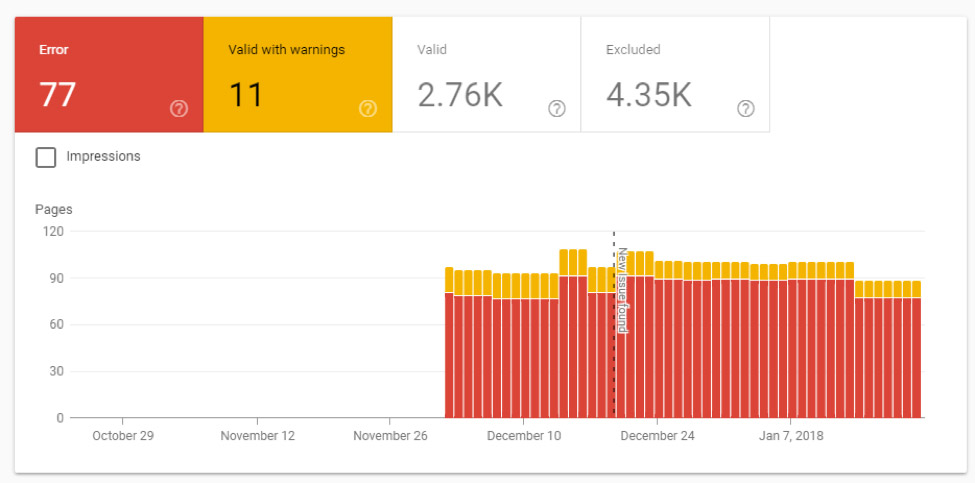
Google also reports on AMP errors and Job Postings errors.
What do GSC enhancements mean for you?
Google Search Console will continue to be a key utility in your website management toolkit. In GSC, you can submit a sitemap, see the broken links to URLs of your site, server errors encountered by Googlebot, see a sample of links, or test robots.txt, etc. The limitation with GSC, however; is that it is not designed for marketers to mine data and synthesize insights. For instance, how many clicks does it take for you to find out what keywords are driving traffic to your page? Furthermore, GSC Search Analytics data mainly shine a light on the efficacy of traffic acquisition through Google, including Clicks, Impressions, CTR, and Position. Users still need to manually marry their SEO metrics and website analytics to paint a full picture of the performance of their website content.
Where do GSC data fit into the content performance workflow?
- In cyberspace
- On the SERP
- On your web page
- On external websites
First, we should briefly discuss the holistic workflow of content performance by reviewing the cyber life stages of content, and where GSC data fits into the life cycle.
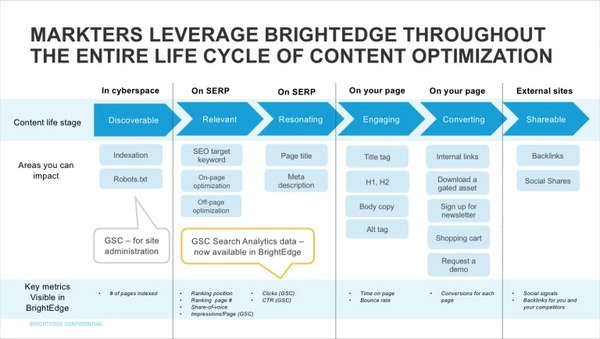
- In cyberspace. When your web page is ready to publish externally, you’ll need to first ensure that this page is discoverable by Google. As discussed above, you use GSC to submit a sitemap, validate indexation, and test robots.txt, to make sure that Googlebot knows to crawl this page and add it to Google’s index.
- On the SERP. Then, your SEO strategy is validated by whether or not Google finds your content relevant to the search query that you target to rank for. Every time Google presents your page against a specific search query, the page receives an impression, no matter what ranking position it may get. SEO is the art to help you increase your ranking position, which influences the total clicks you may receive. The other key element that influences the total clicks you receive is the content presented on Search Engine Results Page (SERP), where your page title and meta description may influence how much your SERP listing will resonate with the searcher in that moment when he/she is browsing the SERP and determining which web listing to click. If your SEO strategy is effective, you will see total Impressions, Clicks, and CTR gradually increase, while Position improves. To improve your SEO strategy, it will be important to understand whom you are competing with for that search intent, where you rank for each of the SERP, which could contain many different content types before organic web listings, and what your true ranking position is. These are the types of data that savvy SEO marketers turn to BrightEdge for. BrightEdge’s proprietary SEO data has been the gold standard in the industry, helping marketers develop and optimize their SEO strategies. With increased investment in R&D, we have also launched several new data collection and syntheses methodologies, such as visual parsing technology, which mimics the search experience through the eyes of a human.
- On your web page. Once the searcher clicks on your web listing, he/she will start engaging with the user experience presented on your website. You can lean on web analytics data to understand how long they stay on each of your webpage (Time on Page), what pages they click in that same session (Entrance Page vs. Exit Page, etc.), and whether or not they leave your site without clicking anything during that same session (Bounce Rate). Engagement is important, but not enough. With effective placement of CTA (call-to-action) links and/or buttons, you will be able to guide your visitor further down the conversion funnel to learn more about your company and product, and eventually, perform the critical conversion actions that your website is designed to do, be it “Request a Demo,” “Sign Up for a Free Trial,” or “Buy Now.” For some, this is where the life cycle of content ends - the ka-ching sound of conversion.
- On external websites. There is actually a way to stretch the life stage of your content - social sharing. Imagine your content is undeniably humorous, contains unique insights not easily attainable, or simply doesn’t exist anywhere else. Your content will sure receive lots of social sharing. These social shares will generate buzz for your content as measured by social mentions, backlinks, and increased SEO equity for your site. Digital marketing ninjas know about this and some spend a considerable amount of money driving social shares. BrightEdge has made it easy for you to see social signals and backlinks for each of your pages. With the introduction of AI-powered BrightEdge Home + Insights, BrightEdge customers receive instant alerts on quality backlinks they have acquired for the most important pages on their site each week.
How to fully unlock the value of GSC enhancements data
GSC data are used in many situations.
- We just launched a new page, I want to know what keywords I’m ranking for this page.
- I want to see if my page is ranking for more keywords after I have implemented content optimization efforts
- For the whole site, I use GSC to review growth trajectory of organic visibility with Google
- I use GSC to review the full list of non-branded queries that my site is ranking for
- Did I drop out of the relevance for certain keywords? When did that happen? I wish I could be the first to know about it
With some of the latest innovations, most of these use cases can be fully accomplished directly from BrightEdge. BrightEdge recently launched deeper integration of the Search Analytics data from GSC into the BrightEdge platform. Customers can now easily see Clicks, Impressions, CTR, and Position of each page or search keyword in the Clicks and Impressions report in the Site Report module of BrightEdge, and they can slice and dice the data by device types. Better yet, users can easily click on each page URL to see the full list of keywords that this page has ranked for. The data are available for either tracked or not-tracked keywords or pages. This deeper integration makes it much easier for SEOs and content performance marketers because they can lean on one platform, BrightEdge, to easily review the KPIs of their content throughout the life cycle of each piece of content. No switching tabs. No jumping back and forth. No spot checking on top of your typical SEO workflow and data mining activities.
Richer data visualization and analysis
- BrightEdge provides powerful ways to compare, contrast, and trend data. You can easily add trend charts of Clicks and Impressions for any given Page or Page Group to your existing dashboards in StoryBuilder.
- You can now easily see if the Clicks, Impressions, CTR, or Position data have gone up or down compared to the week before when reviewing these data points from BrightEdge - something not possible in the current or new GSC portal.
- In the drill-through report of all keywords that are driving Clicks and Impressions to a given page, you can also easily add that entire list of keywords to any dashboard. Thanks to the API integration, this list of keywords will automatically be refreshed each week. This will come in handy, especially when you want to monitor the total list of keywords that the page is ranking for each week - say the landing page of an integrated campaign to support the release of an important new product.
Be the first to know
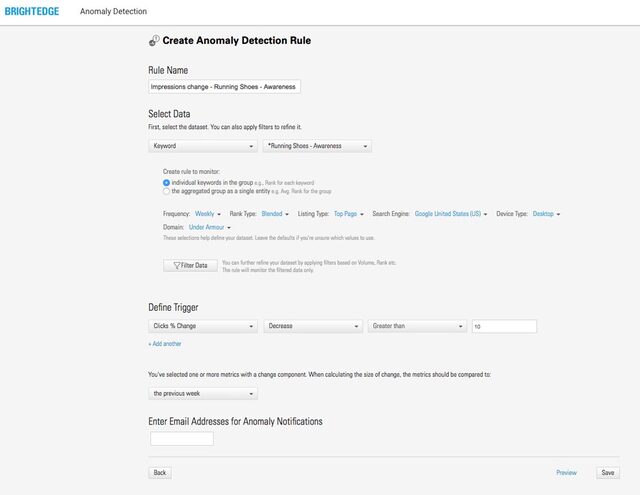
- The integration of GSC data into BrightEdge platform also unlocks the additional capabilities that BrightEdge offers that will enable you to be the first to know of critical SEO KPI variances. For instance, BrightEdge customers can now use Anomaly Detection to be alerted if any of the key pages see a spike of Impressions or Clicks, beyond the expected Impressions or Clicks.
Perpetual GSC data archive
- Customers’ GSC data will be stored by BrightEdge indefinitely as long as the customer remains active. This helps customers to build longer history and richer context of the SEO performance of their content. For instance, when reviewing year-over-year performance variance, there might be an exciting moment, when you see Impressions for a page surged by 30% compared to last year. However, if you review the YoY data of the year before last, you might see that Impressions have been growing by 50% that year also. So, this 30% growth, although still excellent, is perhaps a warning sign that your growth rate has declined.
Conclusion
Google continues to innovate with this recent update to GSC. We will keep you posted on any nuances that will have a significant impact to your site management workflow or results. As stated above, this UI update to the GSC modernizes GSC. However, GSC data do not paint the full picture of content performance workflow. It remains critical for marketers to review the full range of data throughout the content performance life cycle in order to improve on SEO discoverability and the business ROI that their content can produce. BrightEdge’s commitment to on-going investments in providing comprehensive data makes it easy for marketers to succeed. Log into BrightEdge today and see the familiar GSC data, presented with the new and powerful visualization capabilities.