M
Posted 7 years ago
t
9 min read
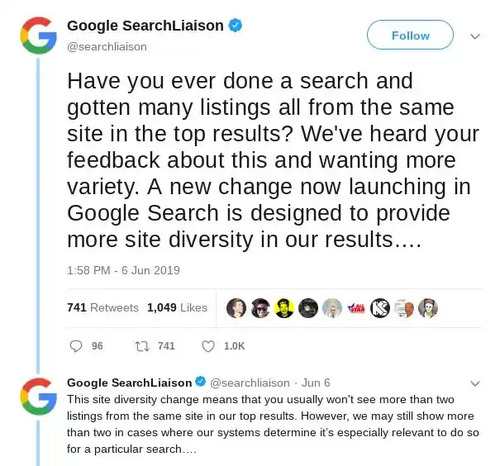
As Google works to match users with the site that will provide them with the best possible results for their query, they also listen to the complaints and suggestions from users. The search engine has said that they understand the frustration users feel when they search for a topic and receive results that list several different pages within the same domain.
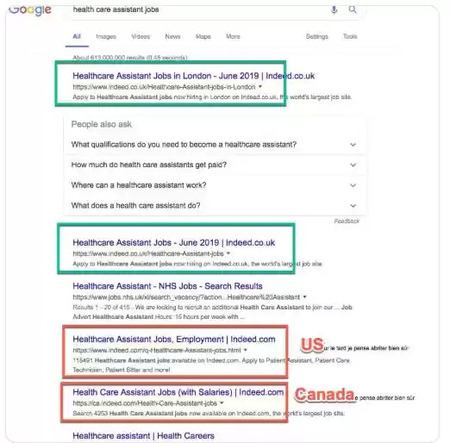
Consider, for example, the results you receive when you type in something related to jobs, health, or reviews of local businesses. Chances are, you will receive multiple results from Indeed.com, WebMD, and Yelp, respectively.
To combat this complaint, Google has announced that they will work to diversify the results they show on the SERP by limiting the number of times that a particular domain can appear in the search results for a particular query.
We wanted to discuss this update with our community to help everyone understand how this change might impact them.
What this update will do
Let’s first explore what precisely the update will do. Google reports that they will look at the domain of a website and limit the number of times it can appear for a particular search to two for most queries. For queries where Google thinks customers might appreciate receiving more than one results from a particular domain, the domain will appear more often.
Google also says that it will treat subdomains as a part of the standard domain. At the same time, at least as of their announcement, Google had not yet limited the number of times a particular company could appear in results if they had different geographic domains. For example, as of the roll-out, users could still see Indeed.com, Indeed.co.uk, and ca.Indeed.com all appearing within the same search results.
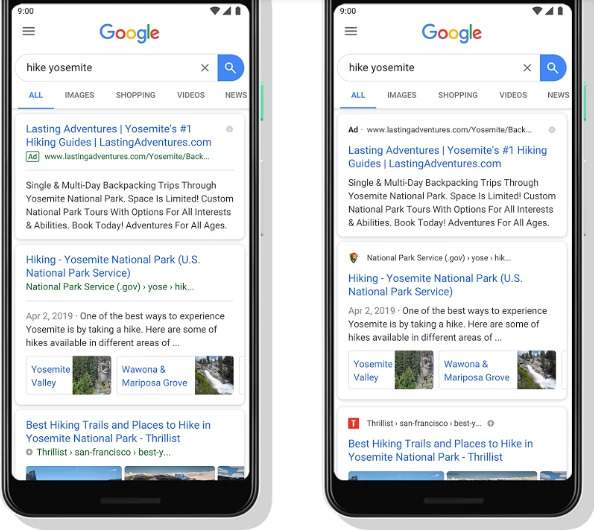
The search engine giant also notes that this change will only impact the main results. This means it will not impact snippets, images, videos, or other types of search results that might appear within universal searches.
The search engine also emphasizes that this update will need regular improvements, although it has completely rolled out. Users may still find errors in how the results appear, but Google says they will work on improving the results moving forward.
How does this update impact users
For users who had more than one page ranking for queries
For sites who have built up strong domains that dominate search results for key searches, this announcement might have been greeted with groans. It is true that those who once had multiple search results may find that their traffic and rankings on the pages in question will decrease.
We recommend that anyone who had multiple results appear for a single query use the BrightEdge platform to monitor their traffic and rankings on these key pages to see how the change might impact their results. See if you can determine which pages Google leaves on the search results and which ones they have bumped off.
If you do have pages that have been bumped off your top rankings with this update, look for other ways to leverage the material of the bumped page. You might consider:
- Optimizing the content for a related keyword to try and earn rankings on another keyword
- Building the piece out further and turning it into a gated item that you can send people to as your CTA from the highly ranked piece
- Shifting the piece to a more internal emphasis, linking to it from within your site to encourage engagement and having your sales team send it to interested prospects.
If you have international domains
Although right now Google still displays sites from the same company even if they have different geographical domains, that might change in the future. Therefore, brands should not rely on this permanently.
If you run multiple sites for different geographic locations, you want to make sure your hreflang tags are working properly. You do not want your country-specific site to get knocked off the front page in favor of your .com page.
If you struggled to rank when you often had to compete against major domains
We have written in the past about brands who have struggled to rank when going head-to-head with dominant domains, such as WebMD. Now these limits have provided these other domains a chance to improve rank.
To look for and capitalize on new opportunities, you will want to use BrightEdge to look for any chances to improve your rankings. Use Recommendations to make sure your ‘striking distance’ pages are fully optimized and ready to move up to the first page. Use BrightEdge Page Reports and Keyword Reports to monitor your rankings and traffic to see if you start to get jumps indicating you have used this update to your advantage.
Making sure your brand still shines on the SERP
Having multiple pages appear on the SERP for a single query provides powerful branding and traffic opportunities. Customers know that you are an authority within the field and that they can trust what you have to say.
Also keep in mind that this change only impacts the core results. That means image, video, and snippets will not change. To build your brand, use BrightEdge Data Cube to look for opportunities to optimize your content for these alternate types of universal results. Including quality images, videos, and optimizing material to improve your chances of appearing in a Quick Answer snippet will all make it easier for you to have multiple appearances on the SERP.
Google’s efforts to increase site diversity, like all updates, will hurt some sites while giving others a boost. Understanding how to best position yourself in the face of these changes, however, can help you achieve the best possible results.