
AI Overviews at the One-Year Mark: Presence, Size, and What They’re Citing
BrightEdge data reveals AI Overviews now trigger on nearly half of all tracked queries — but organic still controls the majority of search. The real story is in how AIOs are growing, what they’re citing, and how dramatically that varies by industry.
BrightEdge data reveals AI Overviews now trigger on nearly half of all tracked queries — but organic still controls the majority of search. The real story is in how AIOs are growing, what they’re citing, and how dramatically that varies by industry.
It’s been a massive year of change in search, and AI Overviews are playing a bigger role than ever. Many marketers are noticing the impact — shifts in click-through rates, changes in traffic patterns, new questions about what’s actually driving visibility.
So we used BrightEdge’s Generative Parser to take a deep look at how AIOs have evolved over the past 12 months. We tracked AIO presence across our keyword set, measured the actual pixel height of AIOs on the page, and analyzed citation overlap — whether the sources Google cites in AIOs are the same ones ranking on page 1 organically.
We then compared citation overlap snapshots a year apart, broken out by industry, to understand how the relationship between organic rankings and AIO citations is evolving across verticals.
Data Collected
Using BrightEdge AI Catalyst™ and our Generative Parser, we analyzed:
- AIO presence: the percentage of tracked keywords triggering an AI Overview, daily over 12 months
- AIO pixel height: the average height of AIOs in pixels, tracked daily over 12 months
- Citation-to-organic overlap: the percentage of AIO-cited sources that also rank in the organic top 10, tracked over a five-month window
- Industry citation overlap: year-over-year snapshots comparing AIO citation overlap with organic rankings across nine verticals
Key Finding
AI Overviews are growing fast — but organic still runs the majority of search. And what Google cites in AIOs is largely different from what ranks on page 1.
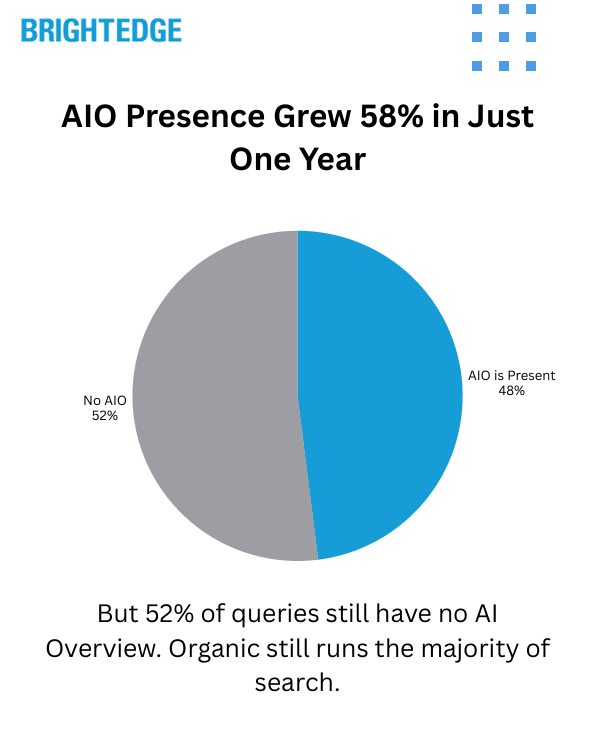
AIO presence has grown from roughly 30% to 48% of tracked queries over the past year — a 58% increase. When AIOs appear, they now average over 1,200 pixels tall, pushing organic results completely below the fold on a standard screen.
But the other side of that number matters just as much: approximately 52% of queries still trigger no AI Overview at all. For the majority of search, organic rankings remain the entire experience.
The citation overlap data adds another layer. Only about 17% of sources cited in AIOs also rank in the organic top 10 — and that number has been flat for months. Roughly 5 out of 6 AIO citations pull from content that isn’t on page 1 of traditional results. This varies dramatically by industry, from 24% overlap in Healthcare to just 11% in Finance.
AIO Presence: From 30% to Nearly Half of All Queries
Over the past 12 months, AIO presence has grown steadily and significantly:
| Time Period | Avg AIO Presence |
| Feb 2025 | ~31% |
| Mar 2025 | ~33% |
| Apr 2025 | ~33% |
| May 2025 | ~37% |
| Jun 2025 | ~42% |
| Jul 2025 | ~44% |
| Aug 2025 | ~47% |
| Sep 2025 | ~46% |
| Oct 2025 | ~44% |
| Nov 2025 | ~45% |
| Dec 2025 | ~46% |
| Jan 2026 | ~47% |
| Feb 2026 | ~48% |
The growth trend has been consistent, with AIO presence crossing the 40% mark in mid-2025 and pushing toward 50% by early 2026. At peak, AIOs appeared on more than half of all tracked queries.
But flip that number around: approximately 52% of queries still have no AI Overview at all. For the majority of search, organic rankings are still the entire experience. That’s not a footnote — it’s the foundation everything else builds on.
AIO Pixel Height: Pushing Organic Below the Fold
When AIOs do appear, they’re taking up more of the screen than ever. We tracked the average pixel height of AIOs daily over the past year:
| Metric | Value |
| Starting avg height (Feb 2025) | ~1,050 pixels |
| Current avg height (Feb 2026) | ~1,200 pixels |
| Year-over-year growth | ~15% |
| Peak monthly average | ~1,340 pixels (Dec 2025) |
| Standard desktop viewport | ~900 pixels |
On a standard desktop viewport of approximately 900 pixels, the average AIO now consumes more than the entire visible screen before a user scrolls. The first organic result sits completely below the fold. Users are getting answers — or at least a substantial response — before they ever see a traditional blue link.
This has direct implications for click-through rates. Even when organic results are strong, the sheer physical space AIOs now occupy means fewer users are making it to the organic listings when an AIO is present.
Citation Overlap: What AIOs Cite vs. What Ranks on Page 1
This is where the data gets especially interesting. We analyzed whether the sources Google cites within AI Overviews are the same sources that rank in the organic top 10 for those queries.
| Month | Top-10 Overlap | % Ranking Somewhere in Top 100 |
| Feb 2025 | ~16.4% | ~48.7% |
| Mar 2025 | ~16.1% | ~49.7% |
| Apr 2025 | ~16.9% | ~50.8% |
| May 2025 | ~16.1% | ~51.0% |
| Jun 2025 | ~16.8% | ~52.8% |
| Jul 2025 | ~16.6% | ~53.1% |
Only about 17% of sources cited in AIOs also rank in the organic top 10. That number has been remarkably flat — barely moving over the entire tracking period. Roughly 5 out of 6 AIO citations are pulling from content that isn’t on page 1 of traditional search results.
What does this mean practically? Ranking #1 organically doesn’t automatically get you cited in the AIO. And not ranking on page 1 doesn’t mean you’re excluded from AIO citations either. The two experiences are connected — but they’re not the same thing.
The broader overlap (sources ranking somewhere in the top 100) has been slowly increasing, from about 49% to 53%. Google is gradually pulling more AIO citations from content that ranks organically — but the page-1 overlap has stayed flat. The growth is coming from content ranking on pages 2 through 10, which users would essentially never reach through traditional organic browsing.
Industry Breakdown: AIO Citation Overlap Varies Dramatically
We compared AIO citation overlap with organic top-10 rankings across nine industries, using snapshots taken a year apart. The differences are striking:
| Industry | Top-10 Overlap (Last Year) | Top-10 Overlap (Today) | Change |
| Healthcare | 23.9% | 24.0% | +0.1pp |
| B2B Tech | 23.9% | 22.6% | -1.3pp |
| Education | 26.9% | 23.1% | -3.8pp |
| Insurance | 22.7% | 22.4% | -0.3pp |
| Entertainment | 3.2% | 18.5% | +15.2pp |
| Travel | 5.7% | 17.7% | +12.0pp |
| eCommerce | 2.9% | 13.4% | +10.5pp |
| Finance | 7.6% | 11.3% | +3.7pp |
| Restaurants | 5.1% | 9.3% | +4.2pp |
Healthcare: The Highest Overlap
Healthcare has the highest top-10 overlap at approximately 24%, and it’s been stable year over year. Google appears to lean heavily on already-trusted, already-ranking sources when generating health-related AIOs — consistent with its YMYL (Your Money or Your Life) approach to sensitive content. If you rank well organically in Healthcare, you’re more likely to be cited in the AIO than in any other vertical.
B2B Tech, Education, and Insurance: Stable Middle Ground
These verticals sit in the low 20s for top-10 overlap and have been relatively stable. About one in four to five AIO citations comes from a page-1 organic result. The majority of citations still come from outside the top 10, but there’s a meaningful connection between organic authority and AIO visibility in these spaces.
Travel, eCommerce, and Entertainment: Massive Year-Over-Year Growth
These verticals saw the most dramatic shifts. Travel’s top-10 overlap jumped from 6% to 18%. eCommerce went from 3% to 13%. Entertainment surged from 3% to 19%. A year ago, AIOs in these verticals were citing almost entirely from outside the organic top 10. That’s changing fast — but even with these gains, the vast majority of AIO citations in these spaces (80%+) still come from outside page 1.
Finance: Low Overlap, High Divergence
Finance has just 11% top-10 overlap — meaning nearly 9 out of 10 AIO citations come from sources outside the organic top 10. This is one of the most divergent verticals, where what Google cites in AIOs looks very different from what ranks on page 1 organically. For finance brands, organic rankings and AIO visibility may require attention to different content signals.
The Non-Ranking Story: How Much Are AIOs Citing Sources Outside the Top 100?
Beyond the top-10 overlap, we also looked at how many AIO citations come from sources that don’t rank anywhere in the top 100 organic results. The year-over-year trend shows AIOs becoming somewhat more aligned with organic rankings overall — but the gap remains large in many verticals:
| Industry | % Not in Top 100 (Last Year) | % Not in Top 100 (Today) | Change |
| Healthcare | 26.4% | 22.5% | -3.8pp |
| B2B Tech | 35.2% | 28.1% | -7.1pp |
| Insurance | 39.0% | 28.3% | -10.8pp |
| Education | 31.1% | 28.2% | -2.8pp |
| Entertainment | 92.2% | 46.6% | -45.6pp |
| Travel | 85.9% | 47.8% | -38.1pp |
| eCommerce | 92.9% | 61.5% | -31.3pp |
| Finance | 82.0% | 65.7% | -16.3pp |
| Restaurants | 88.3% | 76.0% | -12.3pp |
The overall trend is clear: AIOs are becoming more connected to organically-ranking content across the board. But in verticals like Finance (66%), eCommerce (62%), and Restaurants (76%), the majority of AIO citations still come from sources that don’t rank anywhere in the top 100 organic results. These are fundamentally different content sets.
What This Means for Your Search Strategy
- Organic Still Runs the Majority of Search
With approximately 52% of queries triggering no AI Overview at all, organic rankings remain the primary visibility channel for most search activity. The fundamentals — content quality, technical health, topical authority — are the foundation everything builds on.
- When AIOs Appear, They Dominate the Screen
An average AIO now exceeds 1,200 pixels — taller than a standard visible screen. The first organic result sits below the fold. For queries where AIOs are present, click-through rates to organic results are under pressure regardless of ranking position.
- Page-1 Rankings and AIO Citations Are Connected — But Not the Same
Only about 17% of AIO citations come from the organic top 10. Ranking #1 doesn’t guarantee AIO inclusion, and not ranking on page 1 doesn’t mean exclusion. Understanding your visibility across both organic and AIO experiences is essential.
- Your Industry Changes Everything
Healthcare sees 24% top-10 overlap. Finance sees 11%. The relationship between organic rankings and AIO citations is not universal — it’s vertical-specific. Brands need to understand how AIOs behave in their specific industry to make informed decisions.
- The Direction Is Toward More Alignment — But We’re Not There Yet
AIOs are gradually citing more content that also ranks organically, particularly in verticals like Travel, eCommerce, and Entertainment where overlap has grown significantly year over year. But even in the fastest-growing categories, 80%+ of AIO citations still come from outside the organic top 10. The gap is closing, but it’s still wide.
Technical Methodology
Data Source: BrightEdge AI Catalyst™, Generative Parser
Analysis Period: February 2025 – February 2026 (12-month tracking)
AIO Presence: Daily tracking of AI Overview triggering rates across tracked keyword set
AIO Pixel Height: Daily measurement of average AI Overview height in pixels
Citation Overlap: Weekly analysis of overlap between AIO-cited sources and organic ranking positions (top 10, top 100)
Industry Snapshots: Year-over-year comparison of citation overlap across nine verticals
Industries Covered: Healthcare, B2B Tech, Education, Insurance, Entertainment, Travel, eCommerce, Finance, Restaurants
Key Takeaways
- AIO Presence Has Grown Significantly: AI Overviews now trigger on approximately 48% of tracked queries, up from 30% a year ago — a 58% increase. At peak, more than half of all queries showed an AIO.
- But Organic Still Dominates: Approximately 52% of queries have no AI Overview. For the majority of search, traditional organic rankings are the entire user experience.
- AIOs Are Pushing Organic Below the Fold: Average AIO height now exceeds 1,200 pixels, up 15% year over year. On a standard screen, the first organic result sits below the fold when an AIO is present.
- AIO Citations and Page-1 Rankings Are Largely Different: Only about 17% of AIO-cited sources also rank in the organic top 10. This has been flat for months. The content AIOs cite is largely different from what users see on page 1.
- Industry Differences Are Dramatic: Healthcare sees 24% top-10 overlap. Finance sees just 11%. Travel grew from 6% to 18% year over year. Every vertical has a different relationship with AIOs.
- The Trend Is Toward More Alignment: AIOs are gradually citing more organically-ranking content, particularly in Travel, eCommerce, and Entertainment. But even in the fastest-moving verticals, 80%+ of citations still come from outside the top 10.
Download the Full Report
Download the full AI Search Report — AI Overviews at the One-Year Mark: Presence, Size, and What They’re Citing
Click the button above to download the full report in PDF format.
Published on February 12, 2026
AI Search Citations: How Much Do They Really Change Week to Week?
BrightEdge data reveals AI engines are consolidating — not redistributing — citations. The core is remarkably stable. But when changes happen, they're sudden, binary, and overwhelmingly downward.
We track thousands of prompts across ChatGPT, Gemini, Google AI Mode, Google AI Overviews, and Perplexity every week, spanning nine industries. This week we asked a fundamental question: how volatile are AI search citations really? Are the sources AI engines cite and mention changing constantly — or are they more stable than people think?
The answer is encouraging — with an important caveat.
Data Collected
Using BrightEdge AI Catalyst™, we analyzed citation and mention behavior across all five major AI engines to understand::
- How many domains saw week-over-week changes in citation share
- Whether changes skewed toward gains or losses
- How volatility correlates with citation volume and industry
- Whether brand mentions and citations are moving in the same direction
- The relationship between mention rank position and stability
Key Finding
AI search is consolidating, not redistributing. The vast majority of citations are stable week to week — but when changes happen, they're overwhelmingly losses.
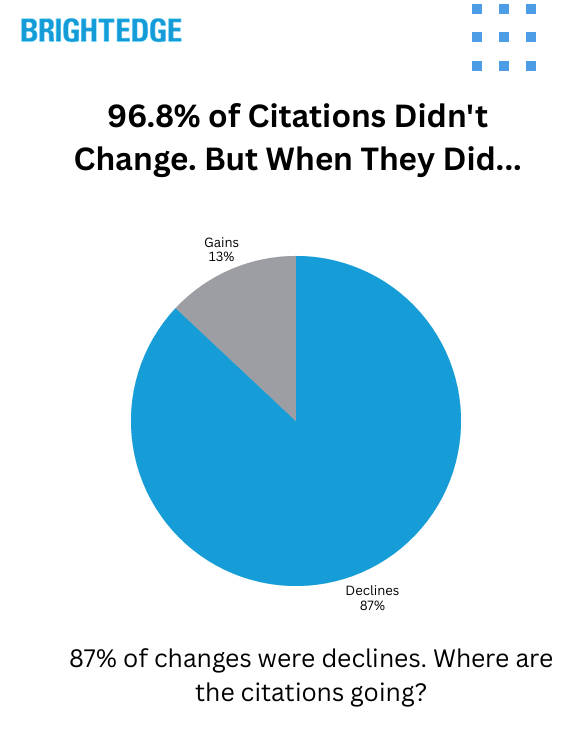
96.8% of cited domains saw zero change week over week. Among the roughly 3% that did move, 87% were declines. Only 13% were gains. And those changes weren't gradual — most were binary, with domains going from cited to not cited at all on a given prompt.
Over 51% of all citation volume was associated with declining domains. Only about 5% was associated with growing ones. The losses aren't being redistributed to new winners. They're disappearing. AI engines are tightening their citation radius — getting more selective about what they link to, not swapping one source for another.
The Stability Story: How Locked In Is the Core?
The headline numbers paint a clear picture of stability:
| Metric | This Week |
| Citations — % of domains with zero change | 96.8% |
| Mentions — % of brands with zero change | 97.2% |
| Top-ranked brands (#1 or #2 position) — % with zero change | 99.4% |
If a domain is part of the trusted citation set for a given prompt, it tends to stay there. And the higher you rank, the more durable your position. Brands in the #1 or #2 mention position are nearly cemented — only 0.6% saw any movement.
That stability drops as you move down the rankings:
| Mention Rank Position | % That Changed | Avg Change |
| Top ranked (1–2) | 0.6% | 0.6% |
| Mid ranked (2–4) | 4.1% | 3.1% |
| Lower ranked (5+) | 3.0% | 2.3% |
The core holds. The volatility lives in the middle and tail positions.
But When Things Change, They Go Down — Fast
Among the ~3% of domains that did see citation changes this week, the direction was overwhelmingly one-sided:
| Direction | % of Changes | Share of Citation Volume |
| Declining | 87% | 51.3% |
| Growing | 13% | 5.3% |
| No change | — | 43.5% |
Most changes were binary. Domains didn't gradually lose a few percentage points of citation share — they went from being cited to not being cited at all on a given prompt. Only about 0.4% of all tracked domains gained new citations this week.
This means the losses aren't flowing to new winners. AI engines are pruning their citation sets without proportional replacement. The citation radius is tightening.
The Core vs. Fringe Dynamic: Why Bigger Footprints See More Churn
At first glance, the data seems counterintuitive: domains with larger citation footprints are more likely to see week-over-week changes. But this makes perfect sense once you understand the two-zone dynamic.
Think of any domain's citation footprint as two zones:
- The core — prompts where it's consistently the best source. Rock solid.
- The fringe — prompts where it's borderline relevant, maybe the 8th or 9th best answer. This is where the churn happens.
A domain cited on just a handful of highly specific prompts is almost certainly there because it's genuinely the best source — there's no fringe zone. A domain cited across thousands of prompts inevitably has a margin of borderline inclusions that can rotate in or out weekly.
The data confirms this:
| Domain Tier | % That Changed | Typical Fringe Size |
| Highest-volume domains (top 50) | 90% | ~5% of citation share |
| Domains with 100+ citations | 65.2% | ~17% of citation share |
| Top 10% by volume | 21.1% | Larger shifts |
| Bottom 50% by volume | 0.4% | Minimal |
Among the very biggest domains, 90% have a fringe — but it's typically only about 5% of their total citation share that's in play any given week. For mid-tier domains with solid footprints, that fringe widens to around 17%.
The core holds. It's the edges that get trimmed.
Citation Concentration: The Rich Get Richer
AI search citations are heavily concentrated among a small number of domains:
| Domain Percentile | Share of All Citations |
| Top 1% | 64% |
| Top 5% | 78% |
| Top 10% | 84% |
Mentions are slightly less concentrated but still steep:
| Brand Percentile | Share of All Mentions |
| Top 1% | 44.5% |
| Top 5% | 62.3% |
| Top 10% | 69.6% |
This concentration, combined with the pruning trend, means the barrier to entry is high and rising. Only 0.4% of domains gained new citations this week. The door in is narrow.
Not All Industries Churn Equally
Citation volatility varies significantly by industry vertical and website type.
Citation Volatility by Website Type
| Website Type | % of Domains That Changed | % of Changes That Were Declines |
| Finance | 51.1% | 91% |
| Review Sites | 45.5% | 100% |
| News/Media | 44.8% | 92% |
| Reference/Encyclopedia | 38.5% | 80% |
| Health/Medical | 34.2% | 100% |
| Video Platforms | 33.3% | 100% |
| eCommerce/Retail | 23.1% | 73% |
| Tech | 15.2% | 91% |
| Government/Institutional | 3.6% | 77% |
Finance sites are the most volatile — over half of tracked finance domains saw citation changes, with 91% of those being declines. Financial data sites, market trackers, and investment research platforms are experiencing the most pruning.
Review sites and news/media follow closely, both skewing heavily negative. Health/medical sites are notable: while "only" 34% changed, 100% of those changes were declines.
eCommerce/retail was the most balanced category, with the highest proportion of positive changes (27% of changes were gains). Government and institutional sites were the most stable at under 4% — when AI engines trust a .gov source, that trust holds.
The Emerging Split: Being Mentioned ≠ Being Cited
One of the most striking patterns this week was the divergence between mentions and citations. Multiple website categories saw their citations drop significantly while their mentions actually increased.
| Website Type | Citation Trend | Mention Trend |
| Social platforms | Large declines (-34% to -45%) | Gains (+11% to +18%) |
| Financial data/analysis sites | Steep declines (-35% to -57%) | Gains (+20% to +65%) |
| Reference/dictionary sites | Declines (-33% to -40%) | Gains (+27% to +67%) |
| Video platforms | Significant decline | Gains (+18%) |
| Review/editorial sites | Declines (-33% to -50%) | Gains (+20% to +25%) |
AI engines are still talking about these sources by name — referencing them in the body of their answers — but increasingly choosing not to link to them.
This suggests that brand authority and citation authority are becoming two different things in AI search. You can be well-known to the models without earning the link. Being mentioned is not the same as being cited — and the gap is growing.
Prompt Landscape: What AI Engines Are Being Asked
While the prompt data doesn't allow week-over-week comparison, it reveals important structural patterns about how AI search works across industries.
Intent Distribution by Industry
| Industry | Consideration | Informational | Transactional |
| eCommerce | 61.5% | 23.1% | 15.2% |
| Travel | 39.5% | 56.6% | 3.9% |
| Finance | 28.1% | 31.4% | 39.9% |
| Restaurants | 27.9% | 33.4% | 38.7% |
| Insurance | 26.5% | 65.8% | 7.7% |
| Education | 22.3% | 75.4% | 2.2% |
| B2B Tech | 14.2% | 76.5% | 8.9% |
| Entertainment | 7.3% | 83.4% | 9.4% |
| Healthcare | 4.3% | 94.2% | 1.5% |
Healthcare is overwhelmingly informational (94.2%) — people are researching symptoms and conditions. eCommerce is majority consideration (61.5%) — people are shopping and comparing. Finance is the most evenly split across all three intents.
Competitive Density by Industry
| Industry | Avg Brands Mentioned Per Prompt | Avg URLs Cited Per Prompt |
| Travel | 26.2 | 24.7 |
| Education | 17.0 | 24.8 |
| Restaurants | 16.4 | 15.9 |
| eCommerce | 16.0 | 16.8 |
| B2B Tech | 14.8 | 20.2 |
| Insurance | 13.4 | 20.4 |
| Finance | 11.4 | 15.1 |
| Healthcare | 11.1 | 21.2 |
| Entertainment | 10.9 | 12.5 |
Travel is the most crowded vertical — an average of 26.2 brands mentioned per prompt and 24.7 URLs cited. If you're competing in travel, the AI answer landscape is significantly more congested than any other industry.
Healthcare shows a unique pattern: relatively few brands per prompt (11.1) but a high URL citation count (21.2). AI engines cite lots of medical sources — medical centers, government health agencies, research databases — but mention fewer commercial brands.
How Citations and Mentions Differ by Intent
| Intent Type | Avg Mentions Per Prompt | Avg Citations Per Prompt |
| Informational | 19.1 | 35.2 |
| Consideration | 27.4 | 29.2 |
| Transactional | 19.0 | 24.6 |
Informational prompts generate nearly twice as many citations as mentions — AI engines are linking to more sources when explaining concepts. Consideration prompts bring mentions closer to citations — brands get named when users are comparing options. Transactional prompts generate the fewest citations — AI engines are more direct when users are ready to act.
What This Means for Your AI Search Strategy
1. If You're in the Core, You're in a Strong Position
97% of citations didn't change this week. Positions at the top of the mention rankings are especially durable — 99.4% of #1 and #2 positions held. If you've built strong AI search presence, that investment is paying off with real stability.
2. But Changes Are Binary — Monitor Before They Happen
Domains don't slowly lose citation share over weeks. They go from cited to not cited in a single cycle. There's no gradual warning. Understanding where you sit — core vs. fringe — on each prompt is how you stay ahead of shifts rather than reacting to them.
3. AI Engines Are Getting More Selective, Not Shifting Preferences
The pruning trend means AI engines are tightening around fewer trusted sources. Losses aren't flowing to competitors. This makes existing positions more valuable — and makes breaking in harder for newcomers. Only 0.4% of domains gained new citations this week.
4. Brand Awareness Isn't Enough — You Need Citation Authority
The growing gap between mentions and citations means being known to AI engines doesn't automatically earn you the link. Optimizing for citation visibility — not just brand mentions — is increasingly important as the two diverge.
5. Know Your Industry's Volatility Profile
Finance and news/media domains face significantly more churn than eCommerce or government sites. If you're in a high-volatility category, monitoring your fringe positions is especially critical — that's where the pruning is happening fastest.
Technical Methodology
Data Source: BrightEdge AI Catalyst™
Analysis Period: Week of February 1, 2026 (week-over-week comparison)
AI Engines Tracked: ChatGPT, Gemini, Google AI Mode, Google AI Overviews, Perplexity
Industries Covered: eCommerce, Healthcare, Finance, Travel, B2B Tech, Entertainment, Education, Restaurants, Insurance
Metrics Analyzed:
- Citation share of voice and week-over-week change by domain
- Mention share and week-over-week change by brand
- Brand average mention rank position
- Prompt intent classification (Informational, Consideration, Transactional)
- Brand and URL density per prompt by industry
Website Type Classification: Domains categorized by type (Finance, Health/Medical, eCommerce/Retail, News/Media, Tech, Government/Institutional, Social/UGC, Video, Review Sites, Reference/Encyclopedia, Travel, Entertainment) based on domain characteristics.
Key Takeaways
AI Search Citations Are Remarkably Stable: 96.8% of cited domains and 97.2% of mentioned brands saw zero change week over week. Top-ranked positions (#1 and #2) are nearly locked in at 99.4% stability.
But When Changes Happen, They're Overwhelmingly Losses: 87% of citation changes were declines. Over 51% of citation volume was associated with declining domains, vs. only 5% with growing ones. Changes are binary — domains drop out entirely rather than fading gradually.
AI Is Consolidating, Not Redistributing: Losses aren't flowing to new winners. AI engines are pruning borderline citations without replacement, tightening around a smaller set of trusted sources. Only 0.4% of domains gained new citations.
Bigger Footprints Have Bigger Fringes: The highest-volume domains are most likely to see changes, but those changes typically affect only ~5% of their citation share. Mid-tier domains see wider fringe exposure (~17%). The core is stable; it's the edges that churn.
Finance Is the Most Volatile Category: 51% of finance domains saw citation changes (91% declines). Review sites, news/media, and health/medical follow. Government sites are the most stable at under 4%.
Brand Mentions and Citations Are Diverging: Multiple categories saw citations decline while mentions increased. AI engines are naming brands without linking to them. Brand authority and citation authority are becoming two separate things.
18 Months of AI Overviews: What Healthcare Tells Us About Where Finance Is Headed
BrightEdge data reveals Google uses the same YMYL playbook for both industries. The difference isn't how Google treats them — it's how people search.
Download the Full Report
Download the full AI Search Report — AI Search Citations: How Much Do They Really Change Week to Week?
Click the button above to download the full report in PDF format.
Published on February 6, 2026
AI Search Citations: How Much Do They Really Change Week to Week?
18 Months of AI Overviews: What Healthcare Tells Us About Where Finance Is Headed
BrightEdge data reveals Google uses the same YMYL playbook for both industries. The difference isn't how Google treats them — it's how people search.
It's been 18 months since Google launched AI Overviews. We now have enough data to see patterns — and make predictions.
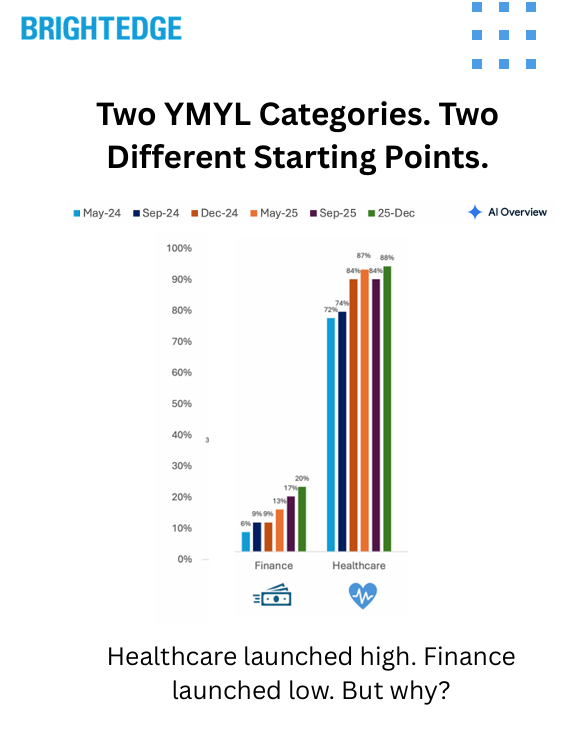
On the surface, Healthcare and Finance look completely different. Healthcare sits at 88% AI Overview coverage. Finance is at 21%. But 18 months of BrightEdge Generative Parser™ data reveals something deeper: Google applies the same logic to both categories. The gap isn't about how Google treats YMYL content — it's about how people search in these industries.
Data Collected
Using BrightEdge Generative Parser™, we analyzed AI Overview presence across Healthcare and Finance from May 2024 through December 2025 to understand:
- How AI Overview coverage evolved in each industry over 18 months
- Which query types saw the fastest expansion
- Where Google kept AI out — and why
- Whether the two YMYL categories follow the same underlying pattern
Key Finding
Google uses the same playbook for both industries. Finance just has a different query mix.
A large portion of Finance search is real-time queries — stock prices, tickers, market data. Healthcare doesn't have an equivalent. Google keeps AI out of real-time data for good reason: you need accuracy, not synthesis.
But when you compare similar query types — the educational, explainer, "help me understand" searches — the trajectory is nearly identical:
- Healthcare educational: 82% → 93% (near saturation)
- Finance educational: 16% → 67% (climbing fast)
Finance educational content is where Healthcare was 12-18 months ago. At current growth rates, Finance will reach Healthcare-level saturation (90%+) by late 2026.
The Headline Gap: Why Finance Looks So Different
At first glance, the numbers tell a simple story:
| Industry | May 2024 | December 2025 | Change |
| Healthcare | 72% | 88% | +16pp |
| Finance | 6% | 21% | +15pp |
Both industries grew roughly the same amount in absolute terms. But Healthcare started high; Finance started low.
The reason isn't Google's caution with financial content. It's the query mix.
Finance Query Composition
Finance search includes a massive real-time component that Healthcare simply doesn't have:
| Query Type | Example Keywords | % of Finance Queries | AIO Rate (Dec '25) |
| Stock Tickers | "AAPL stock price," "NASDAQ," "SPY" | ~70% | 8% |
| Educational | "what is a Roth IRA," "how do bonds work" | ~13% | 67% |
| Trading | "premarket futures," "stock market today" | ~4% | 44% |
| Tools/Calculators | "mortgage calculator," "401k calculator" | ~3% | 11% |
When someone searches "AAPL stock price," they don't need AI synthesis. They need a live price chart. Google's traditional SERP features — the stock widget, the market summary — already do this job perfectly.
Healthcare doesn't have an equivalent category. There's no "diabetes ticker" that needs real-time data. The vast majority of Healthcare searches are educational — symptoms, conditions, treatments — where AI synthesis adds genuine value.
The Parallel: Educational Queries Tell the Real Story
When you isolate educational queries in both industries, the pattern becomes clear:
Healthcare Educational (Specialty Care: Conditions, Symptoms, Treatments)
| Period | AIO Rate |
| May 2024 | 82% |
| September 2024 | 75% |
| December 2024 | 91% |
| May 2025 | 92% |
| September 2025 | 90% |
| December 2025 | 93% |
Healthcare launched high and reached near-saturation within 18 months.
Finance Educational (Tax, Retirement, Planning, Credit)
| Period | AIO Rate |
| May 2024 | 16% |
| September 2024 | 24% |
| December 2024 | 27% |
| May 2025 | 37% |
| September 2025 | 66% |
| December 2025 | 67% |
Finance educational started low but grew 51 percentage points in 18 months — accelerating sharply in 2025.
What This Means
The gap between Healthcare (93%) and Finance (67%) educational queries is now just 26 percentage points — down from 66 points in May 2024.
At Finance's current growth rate, educational content will reach 90%+ saturation by late 2026.
Where Google Expanded in Finance
The growth wasn't uniform. Some Finance categories exploded while others barely moved.
Biggest Movers (May 2024 → December 2025)
| Category | Example Keywords | May '24 | Dec '25 | Growth |
| Tax Planning | "tax brackets," "capital gains tax," "tax refund" | 0% | 63% | +63pp |
| Cash Management | "high yield savings account," "money market" | 13% | 79% | +67pp |
| Financial Planning | "mortgage rates," "CD rates," "compound interest" | 6% | 73% | +67pp |
| Credit & Debt | "student loan forgiveness," "how much house can I afford" | 5% | 62% | +57pp |
| Fixed Income | "treasury bills," "bond rates," "annuity" | 12% | 72% | +60pp |
| Retirement | "Roth IRA," "401k," "social security" | 33% | 61% | +28pp |
What Stayed Flat
| Category | Example Keywords | May '24 | Dec '25 | Growth |
| Stock Tickers | "AAPL stock," "SPY," "TSLA price" | 4% | 8% | +4pp |
| Brand/Navigational | "Fidelity," "Charles Schwab," "Vanguard" | 2% | 14% | +12pp |
The Pattern
Google went all-in on the same query types in Finance that it dominated in Healthcare: educational, explainer, planning content. The categories that grew fastest are the ones where AI synthesis genuinely helps users understand complex topics.
Meanwhile, Google kept AI out of real-time data and navigational queries — the same approach it takes in every industry.
Where Google Kept AI Out — In Both Industries
The most revealing pattern isn't where Google expanded. It's where Google deliberately kept AI out — and how consistent that logic is across both YMYL categories.
Local "Near Me" Queries
| Industry | Query Type | May '24 | Dec '25 |
| Healthcare | "doctor near me," "urgent care near me" | 0% | 11% |
| Finance | "bank near me," "financial advisor near me" | 0% | 20% |
Google tested AI Overviews on local queries in both industries — then pulled back. These queries belong to maps and local pack, not AI synthesis.
Real-Time Data
| Industry | Query Type | AIO Rate (Dec '25) |
| Finance | Stock tickers, market prices | 8% |
| Healthcare | N/A (no equivalent) | — |
Finance has a massive category of queries where real-time accuracy matters more than synthesis. Healthcare doesn't have an equivalent — which is why Healthcare's overall number is so much higher.
The Logic
Google applies the same framework everywhere:
- AI where synthesis adds value: Educational content, explainers, planning queries
- Traditional results where accuracy matters: Real-time data, local queries, navigational searches
The 18-Month Trajectory: Side by Side
Healthcare
| Period | Conditions/Symptoms | General Education | Local |
| May 2024 | 82% | 50% | 0% |
| September 2024 | 75% | 48% | 0% |
| December 2024 | 91% | 64% | 4% |
| May 2025 | 92% | 71% | 14% |
| September 2025 | 90% | 70% | 7% |
| December 2025 | 93% | 74% | 11% |
Finance
| Period | Educational | Real-Time (Tickers) | Local |
| May 2024 | 16% | 4% | 0% |
| September 2024 | 24% | 3% | 0% |
| December 2024 | 27% | 4% | 0% |
| May 2025 | 37% | 4% | 0% |
| September 2025 | 66% | 6% | 0% |
| December 2025 | 67% | 8% | 20% |
What This Means
The trajectories follow the same pattern:
- Educational content saturates first — Healthcare conditions hit 90%+ by December 2024; Finance educational is on the same path
- Local queries get tested, then pulled back — Both industries saw Google experiment with AI on "near me" queries, then reduce coverage
- Real-time/transactional stays flat — Stock tickers in Finance, navigational queries in both industries
Why This Matters: The Prediction
Based on 18 months of data across both YMYL categories, here's what we expect:
Finance Educational Content Will Hit 90%+ by Late 2026
Finance educational queries grew 51 percentage points in 18 months (16% → 67%). At this rate, saturation matching Healthcare (90%+) is 12-18 months away.
The Headline Gap Will Close
As Finance educational content saturates, the overall Finance AI Overview rate will climb toward Healthcare's level. The 67-point gap (21% vs 88%) will narrow significantly — not because Google is changing its approach, but because the query mix effect will diminish as more categories reach saturation.
Local Will Stay Local
Google tested AI Overviews on "near me" queries in both industries and pulled back. This is Maps territory. Don't expect AI to take over local search in YMYL categories.
Real-Time Will Stay Traditional
Stock tickers, market data, and live prices will remain in traditional SERP features. Google won't risk AI synthesis where accuracy matters most.
What This Means for Financial Services Marketers
1. Educational Content Is AI Territory — Optimize Now
Tax explainers, retirement planning guides, mortgage education, credit fundamentals — these query types are already at 60-70% AI Overview coverage and climbing. If you're not optimizing for AI visibility on educational content, you're ceding ground.
2. The Playbook Is Clear: Healthcare Shows the Way
Healthcare's trajectory is Finance's future. The categories that saturated first in Healthcare (conditions, symptoms, treatments) are analogous to what's saturating now in Finance (tax, retirement, planning). Look at where Healthcare is today to see where Finance will be in 12-18 months.
3. Real-Time and Local Are Different Games
If your strategy is focused on stock-related queries or local branch visibility, traditional SEO still applies. AI Overviews aren't taking over these spaces — Google is deliberately keeping them in specialized SERP features.
4. Track Query Intent, Not Just Industry Averages
The headline number (21% for Finance) is misleading. Educational Finance queries are already at 67%. Knowing which of YOUR queries fall into which category — and how AI Overview coverage is changing for each — is essential for strategy.
Technical Methodology
Data Source: BrightEdge Generative Parser™
Analysis Period: May 2024 through December 2025 (6 measurement points: May '24, September '24, December '24, May '25, September '25, December '25)
Sample Size:
- Finance: 2,580 keywords tracked consistently across all periods
- Healthcare: 2,760 keywords tracked consistently across all periods
Categorization:
- Finance queries categorized by L1/L2 taxonomy: Stocks & Trading, Finance & Investing (subdivided into Tax Planning, Retirement, Financial Planning, etc.), Tools, Brands
- Healthcare queries categorized by L1/L2 taxonomy: Specialty Care (Ortho, Neuro, Gastro, etc.), General Health, Primary Care
AI Overview Detection: Keywords classified as having AI Overview if Sge State ≠ "none"
Local Query Identification: Keywords containing "near me" flagged as local intent
Key Takeaways
Google Uses the Same YMYL Playbook for Healthcare and Finance: AI where synthesis adds value (educational content). Traditional results where accuracy matters (real-time data, local queries). The logic is identical across both industries.
The Gap Is About Query Mix, Not Google's Approach: Finance has a large real-time component (stock tickers) that Healthcare doesn't. Remove that from the equation, and the trajectories are nearly parallel.
Finance Educational Content Is Climbing Fast: 16% → 67% in 18 months. The acceleration in 2025 (37% → 67% in just 7 months) suggests Google has gained confidence in AI for financial education content.
Prediction: Finance Hits Healthcare Levels by Late 2026: Educational Finance content will reach 90%+ AI Overview coverage within 12-18 months, matching where Healthcare is today.
The Opportunity Is in Educational Content: For financial services marketers, the path is clear: educational, explainer, and planning content is where AI Overviews are expanding. Optimize for these query types now — before saturation makes it harder to earn visibility.
Download the Full Report
Download the full AI Search Report — 18 Months of AI Overviews: What Healthcare Tells Us About Where Finance Is Headed
Click the button above to download the full report in PDF format.
Published on January 29, 2026
18 Months of AI Overviews: What Healthcare Tells Us About Where Finance Is Headed
Gemini's December Surge: What Citation Data Reveals About Where It's Sending Traffic
BrightEdge data shows Gemini surpassing Perplexity with a 25% referral traffic lead. Gemini grew 33% MoM in December after October upgrades, marking a key moment in AI Darwinism.
This week, BrightEdge released data showing Gemini officially overtook Perplexity in referral traffic share — a 25% lead and a landmark moment in what we're calling AI Darwinism. Gemini's referral traffic grew 33% month-over-month in December, signaling a meaningful increase in user engagement following the October model and product upgrades.
But referral growth only tells us that more users are engaging with Gemini. It doesn't tell us where Gemini is likely sending them. To understand that, we went deeper.
Data Collected
Using BrightEdge AI Catalyst™, we analyzed Gemini's citation behavior throughout November and December to understand:
- Whether citation depth and source diversity changed as usage scaled
- How week-to-week citation patterns shifted during December
- Which query intents saw increases or decreases in citation exposure
- What this means for SEOs trying to earn visibility in Gemini's answers
Key Finding
Gemini scaled without closing off. Despite 33% referral growth, citation depth, domain diversity, and publisher concentration all remained flat. But under the hood, Gemini became more dynamic — week-to-week variance increased 34% — and citation exposure shifted toward research and planning queries. Gemini is scaling as an open discovery layer, not a compressed answer engine.
The Stability Story: Gemini Grew Without Compressing
When AI platforms scale rapidly, there's a concern that they'll compress answers, reduce citations, or concentrate traffic to fewer publishers. Gemini didn't do any of that.
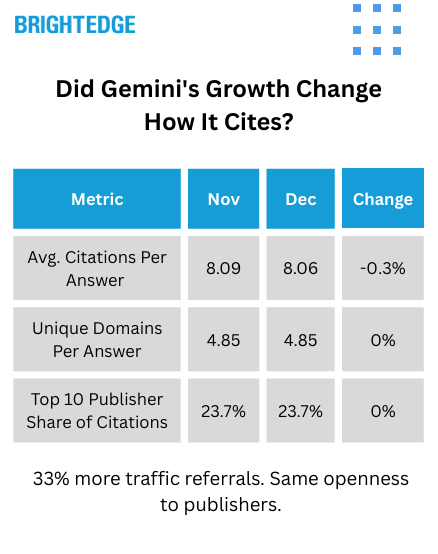
Citation Depth:
- November: 8.09 average citations per answer
- December: 8.06 average citations per answer
- Change: -0.3% (effectively flat)
Domain Diversity:
- November: 4.85 unique domains per answer
- December: 4.85 unique domains per answer
- Change: 0%
Top 10 Publisher Concentration:
- November: 23.7% of all citations
- December: 23.7% of all citations
- Change: 0%
Share of Source-Heavy Answers (10+ citations):
- November: 33.6%
- December: 33.3%
- Change: -0.3 percentage points (effectively flat)
What This Means
As Gemini's audience expanded in December, the platform maintained consistent openness to the web. No collapse in citation depth. No concentration to fewer publishers. No reduction in how often it produced highly-grounded, multi-source answers.
For SEOs, this is encouraging: opportunities to be cited in Gemini — regardless of your site's size — remained unchanged even as usage surged.
Under the Hood: Gemini Got More Dynamic
While overall citation volume stayed flat, Gemini's answer composition became more variable week-to-week in December.
Week-to-Week Standard Deviation:
- November: 0.117
- December: 0.156
- Change: +34% increase in relative variability
Coefficient of Variation:
- November: 1.44%
- December: 1.93%
Weekly Citation Fluctuation
| Week | Avg Citations | WoW % Change |
| Nov Wk 1 | 8.06 | — |
| Nov Wk 2 | 8.20 | +1.7% |
| Nov Wk 3 | 7.90 | -3.6% |
| Nov Wk 4 | 8.08 | +2.3% |
| Nov Wk 5 | 8.07 | -0.1% |
| Dec Wk 1 | 7.88 | -2.3% |
| Dec Wk 2 | 7.99 | +1.3% |
| Dec Wk 3 | 8.21 | +2.8% |
| Dec Wk 4 | 8.18 | -0.4% |
What This Means
The increased variance suggests active tuning and optimization as usage ramped. Gemini wasn't just scaling volume — it was adjusting how it composed answers week-to-week. This is consistent with a platform in active development, testing what works as adoption accelerates.
Query Intent Changes Everything
The most actionable finding: Gemini's citation increases were concentrated in specific query types.
How-To / Instructional Queries:
- November: 8.34 average citations
- December: 8.77 average citations
- Change: +5.2% (the largest category-level increase)
Travel & Planning Queries:
- November: 9.88 average citations
- December: 9.90 average citations
- Change: +0.2%
Comparison / Shopping Queries:
- November: 6.14 average citations
- December: 6.11 average citations
- Change: -0.5%
The Pattern
Gemini increased source grounding in "decision-support" moments — the queries where users move from exploration toward action. How-to queries, travel planning, instructional content. These are high-value research stages where users are learning, evaluating, and forming intent.
Meanwhile, transactional queries (comparison shopping, pricing, "best deals") saw no increase in citation exposure. Gemini held flat in checkout-adjacent moments.
What This Means
If you're only optimizing for transactional queries, you're missing where Gemini is building its connective tissue to the open web. The opportunity is in the research phase — the how-to's, the planning queries, the instructional content that helps users move from awareness to decision.
Why This Matters Beyond Gemini
Gemini isn't just the standalone Gemini app. It's the foundational model powering Google's AI products:
- Google AI Mode runs on Gemini
- Google AI Overviews runs on Gemini
- Apple's Siri is set to be powered by Gemini
Understanding how Gemini cites and connects users to the web matters beyond just one product. As Gemini's reach expands across Google's ecosystem and into Apple's, the citation behaviors we're tracking now will have implications across multiple surfaces where users encounter AI-generated answers.
What This Means for SEOs
Gemini Scaled Without Closing Off: 33% more referral traffic, but citation depth, domain diversity, and publisher concentration all stayed flat. The open web stayed open.
Decision-Support Moments Are the Opportunity: How-to queries (+5.2%) and travel/planning queries (+0.2%) saw citation increases. Transactional queries stayed flat. Optimize for the research phase, not just the purchase moment.
Active Tuning Means Active Opportunity: The 34% increase in week-to-week variance suggests Gemini is still testing and optimizing. Citation patterns aren't locked in — there's room to earn visibility as the platform evolves.
Monitor Gemini Now: With Gemini set to power Siri and already powering AI Mode and AI Overviews, this platform's citation behavior is about to matter a lot more. Anyone with AI Catalyst can track how Gemini's patterns are shifting in their own vertical.
Technical Methodology
Data Source: BrightEdge AI Catalyst™
Analysis Approach:
- Gemini citation data analyzed across November and December 2025
- Weekly aggregation of average citations per answer
- Query intent categorization: How-To/Instructional, Travel & Planning, Comparison/Shopping, and others
- Volatility measured using week-over-week standard deviation and coefficient of variation
- Domain diversity and publisher concentration tracked across the analysis period
Time Period: November 2025 (Weeks 44-48) through December 2025 (Weeks 49-52) and early January 2026 (Week 1)
Key Takeaways
Gemini Scaled as an Open Discovery Layer: Despite 33% referral growth, citation depth (-0.3%), domain diversity (0%), and publisher concentration (0%) all remained flat. Gemini grew without becoming more closed, more shallow, or more concentrated.
Week-to-Week Variance Increased 34%: Overall citation volume stayed flat, but answer composition became more dynamic. Gemini was actively tuning as usage scaled.
Research Queries Saw the Biggest Gains: How-to/instructional queries: +5.2% citation increase. Travel & planning: +0.2%. Comparison/shopping: -0.5%. The increases are concentrated in decision-support moments.
Gemini Powers More Than Gemini: AI Mode, AI Overviews, and soon Siri all run on Gemini. Citation behavior here has implications across Google's AI ecosystem and beyond.
The Opportunity Is in the Research Phase: Gemini is strengthening its role as connective tissue to the open web during learning, planning, and evaluation moments. Brands that optimize for these stages — not just transactional queries — will capture more visibility as Gemini scales.
Download the Full Report
Download the full AI Search Report — Gemini's December Surge: What Citation Data Reveals About Where It's Sending Traffic
Click the button above to download the full report in PDF format.
Published on January 22, 2026
Gemini's December Surge: What Citation Data Reveals About Where It's Sending Traffic
Finance AI Citations: How ChatGPT and Google Define Trust Differently
As we continue our analysis of critical YMYL categories, this week we're examining Finance. When AI answers questions about money, investments, and taxes, accuracy directly impacts users' financial decisions. So who does each platform actually trust?
Data Collected
Using BrightEdge AI Catalyst™, we analyzed finance citations across ChatGPT, Google AI Mode, and Google AI Overviews to understand:
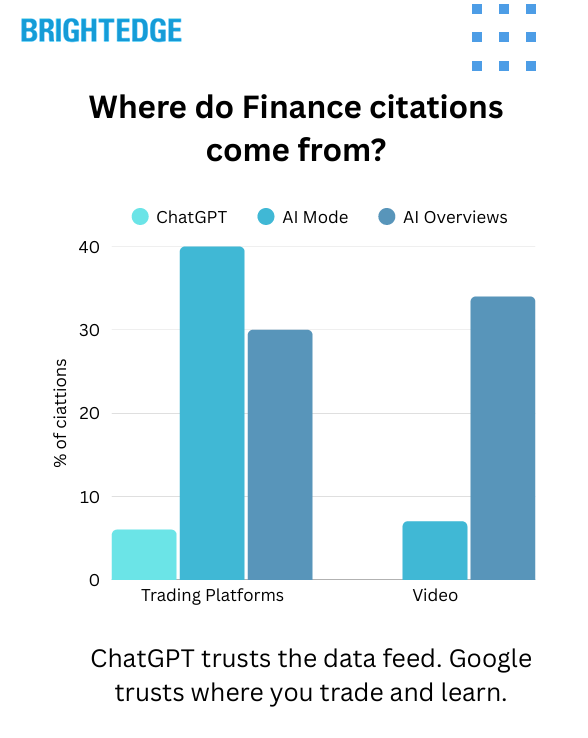
- Which source types each platform cites for finance queries
- How citation patterns differ by query type (stock lookups, tax questions, retirement planning, educational queries)
- Platform stability and volatility in finance citations
- Where Google is experimenting with new content formats like video
Key Finding
Unlike healthcare — where we saw a two-way split between ChatGPT and Google — finance reveals three completely different trust philosophies. ChatGPT trusts financial data aggregators (70%+). Google AI Mode trusts trading platforms (40% — 7x higher than ChatGPT). Google AI Overviews trusts consumer education and video (34% video citations vs. 0% for ChatGPT). Same YMYL category, three fundamentally different approaches to authority.
The Trust Gap: Three Platforms, Three Philosophies
ChatGPT Trusts the Data. AI Mode Trusts Where You Trade. AI Overviews Trusts Where You Learn.
When we analyzed where finance citations actually come from, the platforms diverged sharply:
Financial Data/News: ChatGPT leads at 70%, followed by AI Mode at 51% and AI Overviews at 44%.
Trading Platforms: AI Mode dominates at 40%, with AI Overviews at 30% and ChatGPT far behind at just 6%. Trading platforms appear 7x more often in AI Mode than in ChatGPT.
Consumer Finance Education: AI Overviews leads dramatically at 96% combined share, compared to AI Mode at 42% and ChatGPT at 24%.
Video Content: AI Overviews cites video at 34% — the #2 source category. AI Mode shows 7%. ChatGPT cites zero video for finance queries.
Government (.gov): All three platforms show similar trust levels — ChatGPT at 11%, AI Mode at 12.5%, and AI Overviews at 17%.
ChatGPT leans heavily on financial data aggregators and market news — the platforms that provide real-time stock data, market analysis, and financial journalism.
Google AI Mode goes all-in on trading platforms — the brokerages and investment apps where people actually execute trades.
Google AI Overviews favors consumer finance education and video content — the explainers and educational resources.
The One Thing They Agree On
Government sources (.gov) are trusted at similar rates across all three platforms (11-17%). Regulatory and official sources like IRS, SEC, and FINRA form a baseline of trust. Everything above that baseline diverges dramatically.
Why the Difference? The Interface Explains the Trust Model
This three-way split actually makes sense when you consider the user experience:
AI Overviews still sits atop traditional search results. Users are in browse-and-learn mode — they expect to click through to educational content and watch video explainers. The trust signals reflect that intent.
ChatGPT and AI Mode are chat interfaces where users want direct, data-backed answers. ChatGPT leans toward authoritative data feeds. AI Mode — still within Google's ecosystem — bridges toward transactional sources where users might take action.
The interface drives the trust model.
Query Type Matters: Different Questions, Different Sources
Stock Lookups: Everyone Agrees
When users ask for stock prices or ticker information, all three platforms converge on financial data/news sources — but ChatGPT concentrates trust more heavily:
ChatGPT: 72% from financial data/news, less than 1% from trading platforms.
AI Mode: 50% from financial data/news, 8% from trading platforms.
AI Overviews: 47% from financial data/news, 4% from trading platforms.
ChatGPT trusts fewer sources more deeply for stock data. Google spreads trust wider, giving trading platforms a meaningful share.
Tax Queries: ChatGPT Trusts Government 2x More
For tax-related questions, ChatGPT shows the strongest preference for government sources:
ChatGPT: 50% government, 14% consumer education.
AI Mode: 37% government, 10% consumer education.
AI Overviews: 26% government, 14% consumer education.
ChatGPT is twice as likely to cite IRS and other government sources for tax queries compared to AI Overviews.
Retirement Planning: Same Pattern
For retirement and 401(k) queries, ChatGPT again leads with government sources:
ChatGPT: 39% government, 18% trading platforms, 24% consumer education.
AI Mode: 32% government, 19% trading platforms, 9% consumer education.
AI Overviews: 17% government, 16% trading platforms, 15% consumer education.
ChatGPT takes a government-first approach. Google's products split between government sources AND the platforms where you'd actually open a retirement account.
Educational "How-To" Queries: The Big Divergence
For educational finance queries, the platforms diverge most dramatically:
ChatGPT: 40% consumer education, 0% video, 13% government.
AI Mode: 15% consumer education, 0% video, 12% government.
AI Overviews: 14% consumer education, 9% video, 7% government.
ChatGPT trusts established consumer education publishers. AI Overviews pulls video into financial education queries — a content format ChatGPT isn't touching at all.
Trading/Investment Concepts: AI Overviews Bets on Video
For queries about options, ETFs, dividends, and other investment concepts:
ChatGPT: 23% consumer education, 0% video, 31% financial data/news.
AI Mode: 16% consumer education, 0% video, 15% financial data/news.
AI Overviews: 17% consumer education, 11% video, 12% financial data/news.
AI Overviews is betting that video can explain complex trading concepts. ChatGPT cites zero video for these queries.
The Pattern
For data queries (stock lookups): Everyone agrees — financial news wins.
For sensitive YMYL queries (tax, retirement): ChatGPT trusts government 2x more than AI Overviews.
For educational queries: ChatGPT trusts publishers; AI Overviews trusts video.
Query intent drives trust signals within each platform.
The Volatility Factor: Stability vs. Experimentation
ChatGPT Has Conviction. Google Is Testing.
Beyond source preferences, the platforms differ dramatically in stability:
ChatGPT: 65% average citation volatility (most stable).
AI Mode: 75% average citation volatility.
AI Overviews: 95% average citation volatility (most volatile).
Google's finance citations — especially in AI Overviews — are significantly more volatile than ChatGPT's. What you see in Google AI results today may shift. ChatGPT's citations have remained more stable over our tracking period.
What This Means
ChatGPT appears to have made decisions about finance authority and is sticking with them. Google is still actively experimenting — testing different source mixes, adjusting weights, and iterating on what works. AI Overviews shows the most experimentation, which aligns with its role as a newer feature sitting atop traditional search.
Google's Video Experiment in Finance
The Video Gap Is Massive
ChatGPT: 0% video citations.
AI Mode: 7% video citations.
AI Overviews: 34% video citations.
Google AI Overviews cites video as its #2 source category for finance queries. ChatGPT cites none. This is the most dramatic divergence between the platforms.
Which Query Types Trigger Video?
When Google does cite video for finance, it's concentrated in certain query types:
Trading/Investment Concepts: 11% video in AI Overviews.
How-To/Educational: 9% video.
Retirement Planning: 5% video.
Stock Lookups: 4% video.
Tax Related: Less than 1% video.
Video shows up most on conceptual and educational queries — not tax or stock data. Google appears to be testing where video adds value, starting with explanatory content before expanding to more sensitive YMYL queries.
What This Means for Financial Services Marketers
Track Citations Across All Three Platforms: ChatGPT, AI Mode, and AI Overviews have fundamentally different trust signals. You may be winning citations in one platform and invisible in the others. Measure all three.
Query Intent Matters: Stock lookups, tax questions, and retirement queries all pull from different source mixes. Understand which query types your content targets — and who gets cited for each.
Know Your Source Advantage:
- Financial data aggregators have an edge on ChatGPT
- Trading platforms have an edge on AI Mode
- Consumer education sites have an edge on AI Overviews
- Video content has an edge on AI Overviews (and no presence on ChatGPT)
- Government sources are trusted across all three — the baseline
Google Is Still Testing — ChatGPT Has Decided: Google's higher volatility means your visibility there may shift. ChatGPT is more stable — what you see now is likely what you'll get. Plan accordingly.
Video Is a Major Opportunity (On Google): If you're considering video for finance content, know that AI Overviews is already citing video heavily (34%). But ChatGPT isn't touching it. Your video strategy is a Google play, not a ChatGPT play — at least for now.
Technical Methodology
Data Source: BrightEdge AI Catalyst™
Analysis Approach:
- Finance URL-prompt pairs analyzed across three platforms: ChatGPT, Google AI Mode, Google AI Overviews
- Source categorization by type: Financial Data/News, Trading Platforms, Consumer Finance Education, Government (.gov), Video, Social/Community, Reference, and others
- Query intent categorization: Stock Lookup (Ticker), Stock Lookup (Company), How-To/Educational, Tax Related, Retirement Planning, Trading/Investment Concepts, Credit/Banking, Market Data
- Volatility measured using average percentage changes across citation sources
Data Volume:
- ChatGPT: 11,000+ URL-prompt pairs
- Google AI Mode: 35,000+ URL-prompt pairs
- Google AI Overviews: 30,000+ URL-prompt pairs
Key Takeaways
Three Different Trust Philosophies: ChatGPT trusts financial data aggregators (70%+). AI Mode trusts trading platforms (40% — 7x higher than ChatGPT). AI Overviews trusts consumer education and video (34%). Not a two-way split — a three-way divergence.
Query Intent Drives Trust Signals: Stock lookups converge on financial news. Tax and retirement queries show ChatGPT trusting government 2x more than AI Overviews. Educational queries show AI Overviews pulling in video while ChatGPT trusts publishers.
The Video Gap Is Massive: AI Overviews cites video at 34% (the #2 category). ChatGPT cites 0%. Video is a Google play, not a ChatGPT play.
Government Is the Baseline: All three platforms trust .gov sources at similar rates (11-17%). That's the floor. Everything above it diverges.
ChatGPT Is More Stable: Google's finance citations show higher volatility (75-95%) vs. ChatGPT (65%). Google is experimenting; ChatGPT has conviction.
The Interface Explains the Trust Model: AI Overviews sits atop search results where users browse and learn. Chat interfaces serve users who want direct, data-backed answers. The UX drives the source mix.
Download the Full Report
Download the full AI Search Report — Finance AI Citations: How ChatGPT and Google Define Trust Differently
Click the button above to download the full report in PDF format.
Published on January 15, 2025
Finance AI Citations: How ChatGPT and Google Define Trust Differently
Healthcare AI Citations: How ChatGPT and Google Define Trust Differently
As we head into the new year, we're taking a closer look at critical YMYL categories — starting with Healthcare. When AI answers health questions, accuracy isn't optional. So who does each platform actually trust?
Data Collected
Using BrightEdge AI Catalyst™, we analyzed healthcare citations across ChatGPT, Google AI Mode, and Google AI Overviews over 14 weeks (October 2025 – January 2026) to understand:
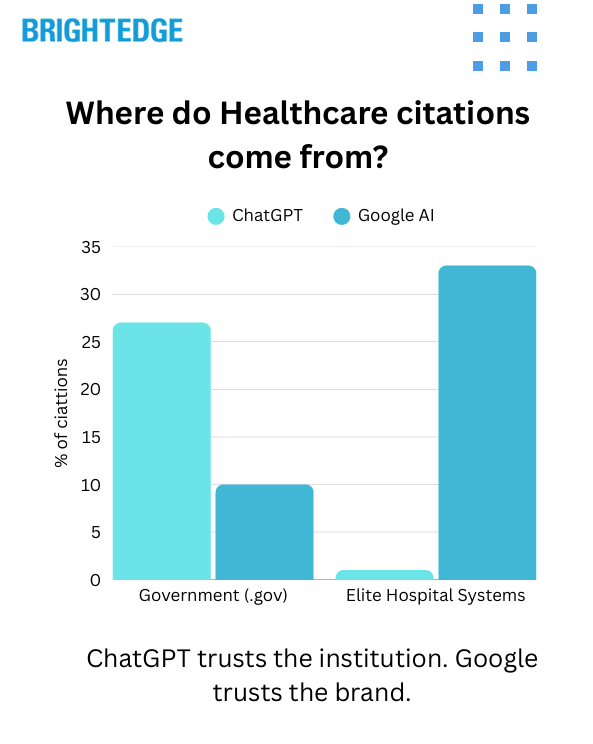
- Which source types each platform cites for healthcare queries
- How citation patterns differ by query type (symptoms, definitions, treatments)
- Platform stability and volatility in healthcare citations
- Where Google is experimenting with new content formats like video
Key Finding
ChatGPT and Google don't agree on what makes a healthcare source authoritative. ChatGPT pulls 27% of its healthcare citations from government sources (.gov) — and just 1% from elite hospital systems. Google AI Overviews flips that entirely: 33% from elite hospital systems, only 10% from government. Same YMYL category, fundamentally different trust signals.
The Trust Gap: Different Platforms, Different Authorities
ChatGPT Trusts the Institution. Google Trusts the Brand.
When we analyzed where healthcare citations actually come from, the platforms diverged sharply:
| Source Type | ChatGPT | Google AI Overviews |
| Government (.gov) | 27% | 10% |
| Elite Hospital Systems | 1% | 33% |
| Medical Specialty Orgs | 17% | 2% |
| Consumer Health Media | 7% | 6% |
ChatGPT leans heavily on government sources like CDC, NIH, and FDA — plus medical specialty organizations (professional associations for cardiology, oncology, orthopedics, etc.).
Google AI Overviews goes all-in on elite hospital systems — major academic medical centers and nationally-ranked health systems.
Neither platform relies heavily on consumer health media (popular health information websites). Both prefer institutional authority — they just define it differently.
The Government vs. Consumer Ratio
How much does each platform prefer official sources over consumer health websites?
- ChatGPT: 4.2:1 ratio (strongly favors official sources)
- Google AI Mode: 1.8:1 ratio
- Google AI Overviews: 2.3:1 ratio
ChatGPT is twice as likely to cite .gov sources over consumer health media compared to Google.
Query Type Matters: Different Questions, Different Sources
Symptom Queries Show the Widest Gap
When users ask about symptoms — arguably the most sensitive healthcare searches — the platforms diverge dramatically:
| Platform | % Citations from Major Hospital Systems |
| ChatGPT | 57% |
| Google AI Mode | 18% |
| Google AI Overviews | 20% |
ChatGPT concentrates trust heavily for symptom queries, pulling nearly 3x more citations from major hospital systems than Google does.
Definition Queries
For "what is" style educational queries:
| Platform | Elite Hospitals | Government | Other |
| ChatGPT | 36% | 15% | 29% |
| Google AI Mode | 12% | 11% | 54% |
| Google AI Overviews | 16% | 12% | 45% |
Treatment Queries
For queries about treatments and procedures:
| Platform | Elite Hospitals | Government | Other |
| ChatGPT | 52% | 8% | 19% |
| Google AI Mode | 17% | 15% | 46% |
| Google AI Overviews | 20% | 11% | 44% |
The Pattern
ChatGPT concentrates citations on fewer, more authoritative sources — especially for sensitive queries like symptoms and treatments. Google distributes citations across a wider mix of sources.
The Volatility Factor: Stability vs. Experimentation
ChatGPT Has Conviction. Google Is Testing.
Beyond source preferences, the platforms differ dramatically in stability:
| Metric | ChatGPT | Google AI Mode | Google AI Overviews |
| Citation Volatility (CV) | 2.1% | 17.1% | 20.2% |
| Week-to-Week Churn | 0.42pp | 2.52pp | 6.94pp |
Google's healthcare citations are 8-10x more volatile than ChatGPT's. What you see in Google AI results today may shift significantly. ChatGPT's citations have remained remarkably stable over our tracking period.
What This Means
ChatGPT appears to have made decisions about healthcare authority and is sticking with them. Google is still actively experimenting — testing different source mixes, adjusting weights, and iterating on what works.
Google's Video Experiment
Where Is Google Testing Video in Healthcare?
One notable difference: Google is experimenting with video content for healthcare answers. ChatGPT isn't citing any video.
- ChatGPT: 0% video citations
- Google AI Overviews: 2.7% video citations
But the volatility tells the real story: video citations in Google AI Overviews swung more than 50 percentage points over just three months (ranging from 22% to 73% of certain result sets). Google hasn't decided whether video belongs in YMYL healthcare content.
Which Query Types Trigger Video?
When Google does cite video for healthcare, it's concentrated in certain query types:
| Query Type | % of Video Citations |
| General Health | 51.5% |
| Symptom Exploration | 21% |
| Condition-Specific | 11.4% |
| Definition/Educational | 5.4% |
| Treatment/Remedies | 5% |
Video shows up most on general health queries — not the most sensitive clinical content. Google appears to be testing carefully, starting with lower-stakes queries before expanding to symptoms and treatments.
Citation Priority: What Users See First
Different Platforms Lead With Different Sources
Beyond which sources get cited, we analyzed which sources appear first (lower rank = higher priority):
ChatGPT Citation Priority:
- Crisis/Support Resources (avg rank 1.7)
- Wikipedia (1.8)
- Medical Specialty Orgs (1.8)
- Elite Hospitals (2.0)
- Government (2.3)
Google AI Overviews Citation Priority:
- Elite Hospitals (avg rank 3.3)
- Wikipedia (3.4)
- Medical Specialty Orgs (4.3)
- Government (5.0)
- Consumer Media (6.3)
ChatGPT puts crisis and support resources first — a deliberate safety choice. Google leads with elite hospital content.
What This Means for Healthcare Marketers
Track Citations Across Both Platforms
ChatGPT and Google have fundamentally different trust signals. You may be winning citations in one platform and invisible in the other. Measure both.
Query Type Matters
Symptom queries, definitions, and treatment searches all pull from different source mixes. Understand which query types your content targets — and who gets cited for each.
Know Your Source Advantage
- Hospital systems: You have an edge on Google AI Overviews
- Government agencies: You have an edge on ChatGPT
- Medical specialty organizations: You have an edge on ChatGPT
- Consumer health media: Neither platform favors you heavily
Google Is Still Testing — ChatGPT Has Decided
Google's 10x higher volatility means your visibility there may shift. ChatGPT is more stable — what you see now is likely what you'll get. Plan accordingly.
Video Is Unsettled
If you're considering video for healthcare content, know that Google's approach is still evolving rapidly. The 50+ percentage point swings suggest this is early experimentation, not settled strategy.
Technical Methodology
Data Source: BrightEdge AI Catalyst™
Analysis Approach:
- Healthcare URL-prompt pairs analyzed across three platforms: ChatGPT, Google AI Mode, Google AI Overviews
- 14 weeks of citation data tracked (October 2025 – January 2026)
- Source categorization by type: Government (.gov), Elite Hospital Systems, Medical Specialty Organizations, Consumer Health Media, Video, Crisis/Support, Wikipedia, and others
- Query intent categorization: Definition, Symptom, Treatment, Condition-Specific, Find Care/Provider, General Health
- Volatility measured using coefficient of variation (CV) and week-over-week percentage point changes
Data Volume:
- ChatGPT: 13,181 URL-prompt pairs
- Google AI Mode: 52,876 URL-prompt pairs
- Google AI Overviews: 47,500 URL-prompt pairs
Measurement Period:
- Citation tracking: October 2025 – January 2026
- Volatility analysis: 14-week rolling window
Key Takeaways
- Different Trust Anchors: ChatGPT pulls 27% from government, 1% from elite hospitals. Google AI Overviews pulls 33% from elite hospitals, 10% from government. Fundamentally different definitions of healthcare authority.
- Symptom Queries Diverge Most: ChatGPT cites major hospital systems for 57% of symptom queries vs. Google's 18-20%. ChatGPT concentrates trust; Google distributes it.
- ChatGPT Is 10x More Stable: Google's healthcare citations show 20% volatility vs. ChatGPT's 2%. Google is experimenting; ChatGPT has decided.
- Neither Trusts Consumer Health Media: Both platforms prefer official sources over popular health websites by 2-4x ratios.
- Video Is Google's Experiment: Google is testing video (2.7% of citations) while ChatGPT cites none. But 50pp swings suggest Google hasn't settled on whether video belongs in YMYL healthcare.
- Query Type Determines Source Mix: Different query intents (symptoms vs. definitions vs. treatments) pull from different source distributions. One-size-fits-all optimization won't work.
Download the Full Report
Download the full AI Search Report — Healthcare AI Citations: How ChatGPT and Google Define Trust Differently
Click the button above to download the full report in PDF format.
Published on January 08, 2026
Healthcare AI Citations: How ChatGPT and Google Define Trust Differently
Finance and AI Overviews: How Google Applies YMYL Principles to Financial Search
Last week we covered Healthcare; this week we focus on Finance (YMYL). We analyzed finance keywords across three years. Google applies similar rules, adapted to financial searches.
Data Collected
We analyzed finance keywords at the same point each December across three years to understand:
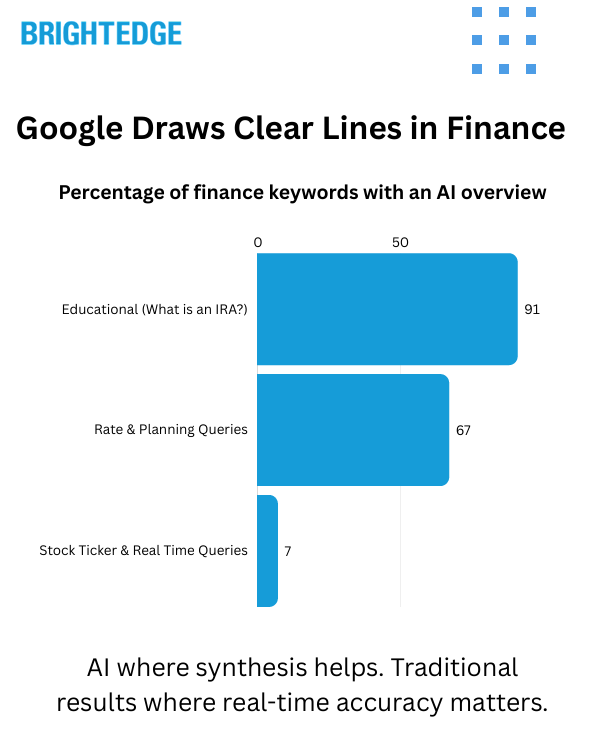
- Year-over-year changes in AI Overview deployment rates
- Query type patterns (educational vs. transactional vs. real-time data)
- Category-level expansion patterns within finance
- Comparisons to Healthcare AI Overview deployment
Key Finding
Google draws clear lines in Finance. AI Overview treatment depends entirely on query type: educational queries like "what is an IRA" hit 91% coverage — nearly identical to Healthcare. But real-time price queries like stock tickers sit at just 7%. And just like Healthcare, Google pulled back from local "near me" queries entirely. Same YMYL principles, adapted to different search behaviors.
Google Draws Clear Lines in FinanceGoogle Draws Clear Lines in Finance
AI Treatment Depends on Query Type
Unlike Healthcare's broad 89% coverage across clinical content, Finance shows distinct zones based on what users are trying to accomplish:
- Educational queries ("what is an IRA"): 91% have AI Overviews
- Rate and planning queries: 67% have AI Overviews
- Stock tickers and real-time prices: 7% have AI Overviews
Google uses AI where synthesis adds value — explaining concepts, comparing options, guiding decisions. For live market data where real-time accuracy matters, Google keeps AI out entirely.
The Real-Time Data Decision
Stock ticker queries represent a deliberate exclusion. Queries like "AAPL stock," "Tesla price," and "Microsoft share price" request real-time price data, not information synthesis.
Google's treatment has been consistent:
- December 2023: 5% had AI Overviews
- December 2024: 4% had AI Overviews
- December 2025: 7% have AI Overviews
This isn't a gap Google is trying to close — it's a line they've drawn. Real-time accuracy matters more than AI synthesis for price lookups.
Where Finance Matches Healthcare
Educational Content Gets the Same Treatment
Google treats educational queries nearly identically across both YMYL industries:
- Finance "what is" queries: 91% have AI Overviews
- Healthcare "what is" queries: 95% have AI Overviews
Examples of finance educational queries with AI Overviews:
- "what is an IRA"
- "how does compound interest work"
- "what is dollar cost averaging"
- "what is a derivative"
- "ebitda meaning"
- "what is a bond"
Planning and Guidance Content
Queries seeking financial planning guidance show similar patterns to healthcare treatment queries:
- Retirement planning queries: 61% have AI Overviews
- Rate information queries: 67% have AI Overviews
- Tax-related queries: 55% have AI Overviews
Examples include "rmd table," "capital gains tax rate," "traditional ira vs roth ira," and "what is long term care insurance."
The Local Pullback — Same Story as Healthcare
Google Removed AI From Local Finance Queries
Last week's biggest Healthcare finding: Google pulled AI Overviews from "near me" queries entirely, dropping from 100% coverage in 2023 to 0% in 2025.
Finance shows the same pattern:
- December 2023 (SGE Labs): 90% of local finance queries had AI Overviews
- December 2024: 0% of local finance queries had AI Overviews
- December 2025: ~10% of local finance queries have AI Overviews
The only local query retaining AI coverage is "tap to pay atm near me" — which is more educational about the feature than truly local intent.
Queries Google Removed AI From
- "Chase bank near me" — NO AIO
- "Wells Fargo near me" — NO AIO
- "Bank of America financial center near me" — NO AIO
- "Financial advisors near me" — NO AIO
- "ATM near me" — NO AIO
- "Moneygram near me" — NO AIO
- "Edward Jones near me" — NO AIO
The Implication
Google tested AI on local queries in both Healthcare and Finance during the SGE Labs period. After broader rollout, they pulled back from both. For "near me" queries, it's all about local pack and maps presence — no AI layer to compete with.
Where AI Is Expanding Fast
Post-Google I/O Growth Trajectory
The SGE-to-AIO transition in May 2024 reset the baseline. Since then, Finance educational and planning content has expanded rapidly.
Post-Google I/O growth (June 2024 → December 2025):
- Educational queries: 70% → 91% (+21 percentage points)
- Fixed income (bonds, CDs, treasury bills): 28% → 72% (+44 percentage points)
- Rate information (mortgage rates, HELOC rates): 26% → 67% (+41 percentage points)
- Tax questions: 0% → 55% (+55 percentage points)
Category Examples
Educational queries include "what is an IRA," "what is dollar cost averaging," "how does compound interest work," and "ebitda meaning."
Fixed income queries include "what is a bond," "treasury bill rates," "cd rates," and "fixed income investments."
Rate information queries include "interest rates today," "current mortgage rates," "heloc rates," "money market rates," and "home equity loan rates."
Tax queries include "capital gains tax rate," "federal tax brackets," and "tax free municipal bonds."
What This Growth Means
If you rank for educational finance content — retirement planning guides, tax explainers, investment education — you're now competing for citations, not just clicks. Traffic may decline even if rankings hold steady, because AI is answering these queries directly.
What Google Keeps AI Out Of
Google has drawn clear lines around query types where AI Overviews don't appear:
Real-Time Price Data
- Individual stock tickers: 7% have AI Overviews
- Market indices: Low AI coverage
- Live price queries: Traditional results dominate
Examples: "AAPL stock," "Tesla price," "dow jones industrial average today," "S&P 500 futures"
Google recognizes that real-time accuracy matters more than AI synthesis for price lookups. These high-volume queries still play by traditional ranking rules.
Local Services
- "Chase bank near me" — NO AIO
- "Wells Fargo near me" — NO AIO
- "Financial advisors near me" — NO AIO
- "ATM near me" — NO AIO
Google determined that local pack results and Maps integrations serve users better than AI summaries for finding bank branches, ATMs, and financial advisors.
Calculator and Tool Queries
- Finance calculator queries: 9% have AI Overviews
- Examples without AI: "401k calculator," "mortgage calculator," "investment calculator," "compound interest calculator"
Users want interactive tools, not AI explanations. Google serves the tools directly.
Brand and Login Queries
- Brand login queries: 0-4% have AI Overviews
- Examples: "fidelity login," "charles schwab login," "td ameritrade login," "robinhood"
Navigational queries go straight to the destination — no AI summary needed.
Finance vs Healthcare: Side-by-Side Comparison
||Healthcare|Finance|
|Educational Query AIO Rate|95%|91%|
|Local "Near Me" AIO Rate|0%|~10%|
|Real-Time Data AIO Rate|N/A|7% (tickers)|
|Overall Trajectory|Near saturation (89%)|Rapid expansion|
|YoY Growth (2024→2025)|+4.6pp|Growing fast in educational categories|
The pattern is consistent: Google uses AI where synthesis adds value (education, explanation, planning) and keeps AI out where real-time accuracy or local relevance matters (live prices, market data, "near me" searches).
Technical Methodology
Data Source: BrightEdge Generative Parser™
Analysis Approach:
- Finance keywords analyzed at equivalent points in December 2023, December 2024, and December 2025
- AI Overview presence tracked by category (L1/L2 taxonomy) and query type
- Query types segmented: educational, rate/planning, real-time/transactional, local intent
- Local intent queries identified and tracked separately
- Trendline data analyzed for post-I/O growth trajectory
Measurement Periods:
- December 2023 snapshot: December 29, 2023
- December 2024 snapshot: December 29, 2024
- December 2025 snapshot: December 26, 2025
- Trendline data: Daily tracking November 2023 through December 2025
Key Takeaways
- Google Draws Clear Lines: AI treatment in Finance depends entirely on query type — 91% for educational, 67% for rates/planning, 7% for stock tickers.
- Educational Content Matches Healthcare: "What is" queries hit 91% AI Overview coverage in Finance — nearly identical to Healthcare's 95%.
- Real-Time Data Stays Out: Stock tickers, market indices, and live price queries sit at 7% AI coverage. Google keeps AI out where real-time accuracy matters.
- Local Pullback Confirmed: Google removed AI from "near me" finance queries just like Healthcare. Bank branches, ATMs, and financial advisors "near me" show minimal AI coverage.
- Rapid Expansion Underway: Educational and planning categories grew 20-55 percentage points in one year. Tax, fixed income, and rate queries are expanding fast.
- Same Principles, Different Application: Both YMYL industries show identical patterns — AI for education, traditional results for local and real-time data.
Industry Implications:
This research confirms that Google applies consistent YMYL principles across industries while adapting to category-specific search behaviors.
For financial services marketers, the implications are significant:
Educational content = New metrics. Retirement planning guides, tax explainers, investment education, "what is" content — expect AI Overviews on most of these queries. If traffic declined while rankings held steady, AI — not your content — is likely the cause. Track citations, not just clicks.
Real-time data = Traditional rankings. Stock prices, market indices, ticker lookups — Google keeps AI out. These high-volume queries still play by traditional ranking rules. Position tracking tells the full story here.
Local "near me" = Maps territory. Bank branches, ATMs, financial advisors — no AI layer to compete with. Google Business Profile optimization and local pack presence drive these results.
The expansion continues. Unlike Healthcare (near saturation at 89%), Finance educational content is still growing rapidly. Categories at 55-70% today could reach 80-90% by late 2026. Plan your measurement strategy accordingly.
Two metrics now matter. For educational and planning content, track AI citation presence alongside traditional rankings. For real-time and local queries, traditional position tracking still tells the full story.
Same strategy, different emphasis. Quality content and technical SEO excellence work across both AI and traditional results. Understanding WHERE your visibility lives helps you measure success correctly and allocate resources appropriately.
Download the Full Report
Download the full AI Search Report —Finance and AI Overviews: How Google Applies YMYL Principles to Financial Search
Click the button above to download the full report in PDF format.
Published on January 03, 2026
Finance and AI Overviews: How Google Applies YMYL Principles to Financial Search
Healthcare and AI Overviews: How Google Sharpened Its Approach Over Three Years
Using BrightEdge Generative Parser™, we tracked healthcare keywords over three annual snapshots (Dec 2023, 2024, and 2025). The data shows Google increasing AI-related content in clinical topics, while reducing focus on local and sensitive health queries.
Data Collected
We analyzed healthcare keywords at the same point each December across three years to understand:
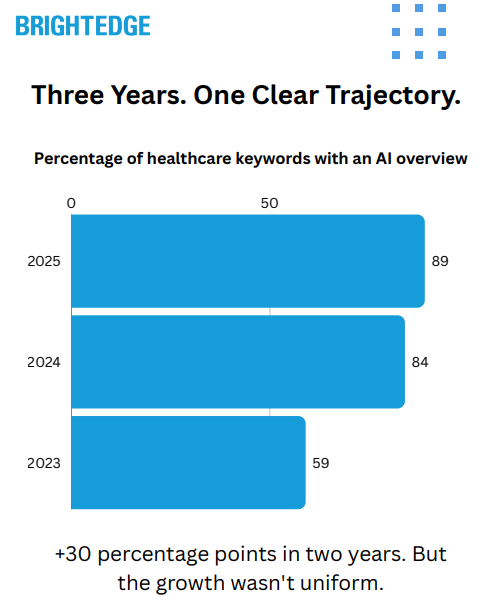
- Year-over-year changes in AI Overview deployment rates
- Query type patterns (clinical vs. local vs. sensitive topics)
- Specialty-level expansion patterns within healthcare
- Stability and volatility trends over time
Key Finding
Google expanded AI Overview coverage in healthcare from 59% to 89% over two years — but drew clear boundaries. Clinical content is now near-saturated (93-100% coverage), while local "near me" queries saw a complete reversal: from 100% AI Overview presence in 2023 to 0% today. Google isn't treating all healthcare queries the same. They're matching AI presence to query type — and they've stabilized their approach.
The Three-Year Transformation
December 2023: 59% of Keywords Had AI Overviews
In late 2023, Google was still in expansion mode with AI Overviews (then called SGE). Healthcare showed moderate coverage, with roughly six in ten queries triggering an AI-generated response.
This was the testing phase. Google was learning where AI helped users and where it created problems — particularly in a Your Money Your Life (YMYL) category like healthcare.
December 2024: 84% of Keywords Had AI Overviews
The biggest expansion happened between 2023 and 2024. AI Overview presence jumped 25 percentage points in a single year as Google rolled out the feature broadly following Google I/O 2024.
Healthcare saw aggressive growth across most clinical categories during this period.
December 2025: 89% of Keywords Have AI Overviews
Growth continued but decelerated significantly — just 5 percentage points year-over-year. This suggests Google has reached near-saturation for the query types it intends to cover.
The slower growth isn't hesitation. It's refinement. Google drew lines on where AI belongs in healthcare search.
The Intent Interpretation
The 30 percentage point expansion from 2023 to 2025 wasn't uniform. It reflects Google's learning about healthcare search intent:
- Clinical information intent → Heavy AI treatment (symptoms, treatments, conditions)
- Local provider intent → AI removed entirely (Google reversed course)
- Sensitive health topics → AI consistently excluded (crisis, mental health)
Google is matching SERP treatment to query risk profile, not just search volume or category.
Where Google Went All-In: Clinical Content
Query Type Breakdown (December 2025)
Treatment and procedure queries now show 100% AI Overview presence — up from 45% in 2023. This represents a 55 percentage point increase.
Pain-related queries show 98% AI Overview presence — up from 58% in 2023. This represents a 40 percentage point increase.
Symptoms and conditions queries show 93% AI Overview presence — up from 57% in 2023. This represents a 36 percentage point increase.
Medical coding queries (ICD-10, CPT) show 90% AI Overview presence — up from 67% in 2023. This represents a 23 percentage point increase.
What This Means for Clinical Content
If you're measuring organic traffic on treatment pages, symptom guides, or condition explainers — and seeing declines while rankings hold steady — AI Overviews are likely the cause.
A Position 1 ranking on "rotator cuff surgery recovery" doesn't deliver the same traffic it did in 2023. The AI Overview answers the query before users reach organic results.
The Specialty Breakdown
- Google's expansion varied significantly by medical specialty. Core clinical specialties saw the highest coverage:
- Genetic/Genomic content: 97% have AI Overviews (up from 63% in 2023)
- Cardiology content: 96% have AI Overviews (up from 63% in 2023)
- Urology content: 96% have AI Overviews (up from 68% in 2023)
- Gastroenterology content: 94% have AI Overviews (up from 41% in 2023)
- Orthopedics content: 94% have AI Overviews (up from 63% in 2023)
- Neurology content: 89% have AI Overviews (up from 64% in 2023)
- Lower coverage categories include:
- Primary Care content: 74% have AI Overviews (up from 66% in 2023)
- Mental Health/Behavioral content: 63% have AI Overviews (up from 58% in 2023)
- Eating Disorders content: 63% have AI Overviews (up from 32% in 2023)
- The pattern: clinical specialties with clear diagnostic and treatment pathways saw the most aggressive expansion. Categories intersecting with sensitive topics or local intent saw more conservative treatment.
Where Google Pulled Back: The Reversal Story
Local "Near Me" Queries: 100% → 0%
This is the most significant finding in the data. Google completely reversed its approach to local healthcare searches.
- December 2023: 100% of local/provider intent queries had AI Overviews
- December 2024: 14% of local/provider intent queries had AI Overviews
- December 2025: 0% of local/provider intent queries have AI Overviews
Queries affected include searches like "dermatologist near me," "cardiologist near me," "pediatric dentist near me," and "best family doctor near me."
Google tested AI Overviews on these queries. Then removed them entirely.
Why This Matters
User-Generated Content
For healthcare practices, clinics, and hospital systems: your local SEO investment still pays off. Google has decided — at least for now — that local healthcare provider searches should be handled by traditional local results (Maps, local pack, organic listings) rather than AI summaries.
The queries that drive new patient acquisition remain traditional SEO territory.
Visual and Imaging Content: 45% → 30%
Queries seeking medical images, X-rays, or diagnostic visuals also saw Google pull back:
- December 2023: 45% had AI Overviews
- December 2025: 30% have AI Overviews
Queries like "broken ankle x-ray," "MRI results interpretation," and "skin cancer pictures" don't lend themselves to text-based AI summaries. Google recognized this and reduced coverage.
This creates an opportunity: image-rich medical content faces less AI competition than text-based clinical content.
Where Google Consistently Excludes AI
Some healthcare topics have shown zero or near-zero AI Overview presence across all three years. Google has clearly made policy decisions to keep AI out of these areas:
Consistently Excluded (0% AI Overviews)
- Self-harm and suicide-related queries
- Specific eating disorder names (anorexia, bulimia)
- Crisis intervention terminology
- Addiction-related queries
Consistently Low Coverage
- Mental health crisis terminology
- Abuse-related queries
- Visual diagnostic content
The Implication
If your content focuses on sensitive mental health topics, traditional SEO fundamentals still apply. Rankings matter. Featured snippets matter. AI isn't intercepting these users — Google has determined that human-curated results are more appropriate.
The Stability Factor: Volatility Is Over
Early 2024: High Volatility
If your content focuses on sensitive mental health topics, traditional SEO fundamentals still apply. Rankings matter. Featured snippets matter. AI isn't intercepting these users — Google has determined that human-curated results are more appropriate.
Late 2025: Stable Deployment
By late 2025, monthly volatility dropped to approximately 5 percentage points. Google has settled into a steady state.
What This Means for Planning
The wild experimentation phase is over. What you see now is Google's established approach to healthcare AI Overviews. You can plan content strategy around these patterns with reasonable confidence they'll persist.
Search Volume Analysis
AI Overview deployment in healthcare does not significantly vary by search volume:
- High volume keywords (100K+ monthly searches): 89% have AI Overviews
- Medium volume keywords (10K-100K monthly searches): 88% have AI Overviews
- Low volume keywords (1K-10K monthly searches): 89% have AI Overviews
- Very low volume keywords (under 1K monthly searches): 100% have AI Overviews
Google isn't reserving AI Overviews for high-traffic queries. Even long-tail, low-volume medical queries now predominantly feature AI-generated responses.
The decision factor isn't volume — it's query type and intent.
Technical Methodology
Data Source: BrightEdge Generative Parser™
Analysis Approach:
- Healthcare keywords analyzed at equivalent points in December 2023, December 2024, and December 2025
- AI Overview presence tracked by specialty area (L2 taxonomy) and query type
- Query intent patterns categorized by clinical, local, sensitive, and visual content types
- Stability measured by monthly variance in AI Overview deployment rates
Measurement Periods:
- December 2023 snapshot: December 22, 2023
- December 2024 snapshot: December 22, 2024
- December 2025 snapshot: December 22, 2025
- Trendline data: Daily tracking November 2023 through December 2025
All figures expressed as percentages to protect proprietary dataset composition.
Key Takeaways
- The Coverage Expansion: Healthcare AI Overview presence grew from 59% to 89% over two years — a 30 percentage point increase. Most growth occurred between 2023 and 2024.
- The Clinical Saturation: Treatment queries (100%), pain-related queries (98%), and symptom queries (93%) are now near-fully covered by AI Overviews. Clinical content is AI territory.
- The Local Reversal: "Near me" and provider-finding queries went from 100% AI Overview coverage in 2023 to 0% in 2025. Google completely reversed course on local healthcare search.
- The Sensitivity Boundaries: Self-harm, eating disorder names, crisis terms, and addiction queries remain consistently excluded from AI Overviews across all three years.
- The Specialty Pattern: Clinical specialties (Cardiology, Gastro, Ortho) show 94-97% coverage. Mental health and primary care show 63-74% coverage.
- The Stability Shift: Monthly volatility dropped from ~20 percentage points in early 2024 to ~5 percentage points in late 2025. Google's approach has stabilized.
Industry Implications:
This research confirms that Google's AI Overview strategy for healthcare has moved from experimentation to established policy. The testing phase produced clear conclusions that now govern deployment.
For healthcare marketers and SEO professionals, the implications are significant:
The landscape has bifurcated. Clinical information queries are AI territory — expect AI Overviews on nearly every symptom, treatment, or condition query. Local provider queries remain traditional SEO territory — Google removed AI entirely.
Traffic declines may not indicate content problems. If your clinical content shows declining traffic while rankings hold steady, AI Overviews — not content quality — are likely the cause. Adjust your success metrics accordingly.
Local SEO still delivers. For practices, clinics, and hospital systems focused on patient acquisition, Google Business Profile optimization and local search fundamentals still drive results. Google kept AI out of these queries.
Sensitive content follows traditional rules. Mental health crisis content, eating disorder resources, and addiction support pages compete in a traditional SERP environment. E-E-A-T signals and authoritative sourcing remain your primary levers.
Two metrics now matter. For clinical content, track AI citation presence alongside traditional rankings. For local content, traditional position tracking still tells the full story.
The system has stabilized. Unlike the volatile deployment of early 2024, Google's current approach appears settled. Plan your 2026 strategy around these patterns with confidence.
Download the Full Report
Download the full AI Search Report — Healthcare and AI Overviews: How Google Sharpened Its Approach Over Three Years
Click the button above to download the full report in PDF format.
Published on December 24, 2025