AI Overviews at the One-Year Mark: Presence, Size, and What They’re Citing
BrightEdge data reveals AI Overviews now trigger on nearly half of all tracked queries — but organic still controls the majority of search. The real story is in how AIOs are growing, what they’re citing, and how dramatically that varies by industry.
BrightEdge data reveals AI Overviews now trigger on nearly half of all tracked queries — but organic still controls the majority of search. The real story is in how AIOs are growing, what they’re citing, and how dramatically that varies by industry.
It’s been a massive year of change in search, and AI Overviews are playing a bigger role than ever. Many marketers are noticing the impact — shifts in click-through rates, changes in traffic patterns, new questions about what’s actually driving visibility.
So we used BrightEdge’s Generative Parser to take a deep look at how AIOs have evolved over the past 12 months. We tracked AIO presence across our keyword set, measured the actual pixel height of AIOs on the page, and analyzed citation overlap — whether the sources Google cites in AIOs are the same ones ranking on page 1 organically.
We then compared citation overlap snapshots a year apart, broken out by industry, to understand how the relationship between organic rankings and AIO citations is evolving across verticals.
Data Collected
Using BrightEdge AI Catalyst™ and our Generative Parser, we analyzed:
- AIO presence: the percentage of tracked keywords triggering an AI Overview, daily over 12 months
- AIO pixel height: the average height of AIOs in pixels, tracked daily over 12 months
- Citation-to-organic overlap: the percentage of AIO-cited sources that also rank in the organic top 10, tracked over a five-month window
- Industry citation overlap: year-over-year snapshots comparing AIO citation overlap with organic rankings across nine verticals
Key Finding
AI Overviews are growing fast — but organic still runs the majority of search. And what Google cites in AIOs is largely different from what ranks on page 1.
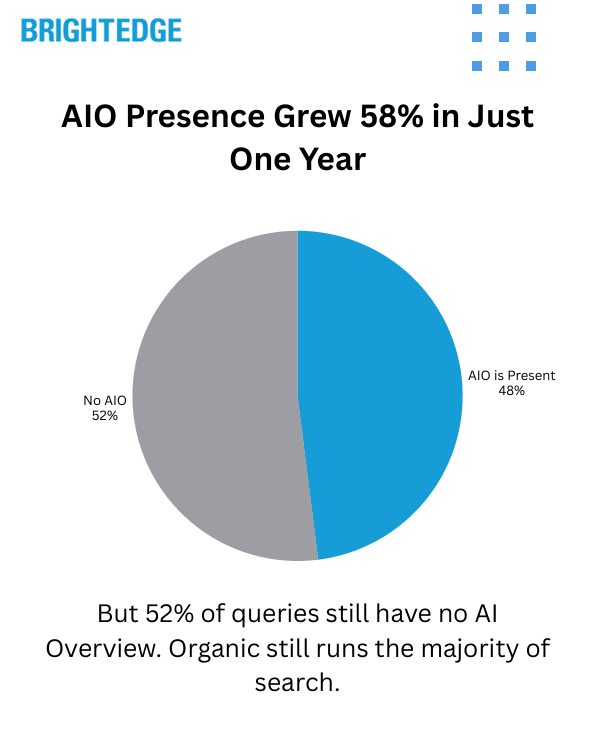
AIO presence has grown from roughly 30% to 48% of tracked queries over the past year — a 58% increase. When AIOs appear, they now average over 1,200 pixels tall, pushing organic results completely below the fold on a standard screen.
But the other side of that number matters just as much: approximately 52% of queries still trigger no AI Overview at all. For the majority of search, organic rankings remain the entire experience.
The citation overlap data adds another layer. Only about 17% of sources cited in AIOs also rank in the organic top 10 — and that number has been flat for months. Roughly 5 out of 6 AIO citations pull from content that isn’t on page 1 of traditional results. This varies dramatically by industry, from 24% overlap in Healthcare to just 11% in Finance.
AIO Presence: From 30% to Nearly Half of All Queries
Over the past 12 months, AIO presence has grown steadily and significantly:
| Time Period | Avg AIO Presence |
| Feb 2025 | ~31% |
| Mar 2025 | ~33% |
| Apr 2025 | ~33% |
| May 2025 | ~37% |
| Jun 2025 | ~42% |
| Jul 2025 | ~44% |
| Aug 2025 | ~47% |
| Sep 2025 | ~46% |
| Oct 2025 | ~44% |
| Nov 2025 | ~45% |
| Dec 2025 | ~46% |
| Jan 2026 | ~47% |
| Feb 2026 | ~48% |
The growth trend has been consistent, with AIO presence crossing the 40% mark in mid-2025 and pushing toward 50% by early 2026. At peak, AIOs appeared on more than half of all tracked queries.
But flip that number around: approximately 52% of queries still have no AI Overview at all. For the majority of search, organic rankings are still the entire experience. That’s not a footnote — it’s the foundation everything else builds on.
AIO Pixel Height: Pushing Organic Below the Fold
When AIOs do appear, they’re taking up more of the screen than ever. We tracked the average pixel height of AIOs daily over the past year:
| Metric | Value |
| Starting avg height (Feb 2025) | ~1,050 pixels |
| Current avg height (Feb 2026) | ~1,200 pixels |
| Year-over-year growth | ~15% |
| Peak monthly average | ~1,340 pixels (Dec 2025) |
| Standard desktop viewport | ~900 pixels |
On a standard desktop viewport of approximately 900 pixels, the average AIO now consumes more than the entire visible screen before a user scrolls. The first organic result sits completely below the fold. Users are getting answers — or at least a substantial response — before they ever see a traditional blue link.
This has direct implications for click-through rates. Even when organic results are strong, the sheer physical space AIOs now occupy means fewer users are making it to the organic listings when an AIO is present.
Citation Overlap: What AIOs Cite vs. What Ranks on Page 1
This is where the data gets especially interesting. We analyzed whether the sources Google cites within AI Overviews are the same sources that rank in the organic top 10 for those queries.
| Month | Top-10 Overlap | % Ranking Somewhere in Top 100 |
| Feb 2025 | ~16.4% | ~48.7% |
| Mar 2025 | ~16.1% | ~49.7% |
| Apr 2025 | ~16.9% | ~50.8% |
| May 2025 | ~16.1% | ~51.0% |
| Jun 2025 | ~16.8% | ~52.8% |
| Jul 2025 | ~16.6% | ~53.1% |
Only about 17% of sources cited in AIOs also rank in the organic top 10. That number has been remarkably flat — barely moving over the entire tracking period. Roughly 5 out of 6 AIO citations are pulling from content that isn’t on page 1 of traditional search results.
What does this mean practically? Ranking #1 organically doesn’t automatically get you cited in the AIO. And not ranking on page 1 doesn’t mean you’re excluded from AIO citations either. The two experiences are connected — but they’re not the same thing.
The broader overlap (sources ranking somewhere in the top 100) has been slowly increasing, from about 49% to 53%. Google is gradually pulling more AIO citations from content that ranks organically — but the page-1 overlap has stayed flat. The growth is coming from content ranking on pages 2 through 10, which users would essentially never reach through traditional organic browsing.
Industry Breakdown: AIO Citation Overlap Varies Dramatically
We compared AIO citation overlap with organic top-10 rankings across nine industries, using snapshots taken a year apart. The differences are striking:
| Industry | Top-10 Overlap (Last Year) | Top-10 Overlap (Today) | Change |
| Healthcare | 23.9% | 24.0% | +0.1pp |
| B2B Tech | 23.9% | 22.6% | -1.3pp |
| Education | 26.9% | 23.1% | -3.8pp |
| Insurance | 22.7% | 22.4% | -0.3pp |
| Entertainment | 3.2% | 18.5% | +15.2pp |
| Travel | 5.7% | 17.7% | +12.0pp |
| eCommerce | 2.9% | 13.4% | +10.5pp |
| Finance | 7.6% | 11.3% | +3.7pp |
| Restaurants | 5.1% | 9.3% | +4.2pp |
Healthcare: The Highest Overlap
Healthcare has the highest top-10 overlap at approximately 24%, and it’s been stable year over year. Google appears to lean heavily on already-trusted, already-ranking sources when generating health-related AIOs — consistent with its YMYL (Your Money or Your Life) approach to sensitive content. If you rank well organically in Healthcare, you’re more likely to be cited in the AIO than in any other vertical.
B2B Tech, Education, and Insurance: Stable Middle Ground
These verticals sit in the low 20s for top-10 overlap and have been relatively stable. About one in four to five AIO citations comes from a page-1 organic result. The majority of citations still come from outside the top 10, but there’s a meaningful connection between organic authority and AIO visibility in these spaces.
Travel, eCommerce, and Entertainment: Massive Year-Over-Year Growth
These verticals saw the most dramatic shifts. Travel’s top-10 overlap jumped from 6% to 18%. eCommerce went from 3% to 13%. Entertainment surged from 3% to 19%. A year ago, AIOs in these verticals were citing almost entirely from outside the organic top 10. That’s changing fast — but even with these gains, the vast majority of AIO citations in these spaces (80%+) still come from outside page 1.
Finance: Low Overlap, High Divergence
Finance has just 11% top-10 overlap — meaning nearly 9 out of 10 AIO citations come from sources outside the organic top 10. This is one of the most divergent verticals, where what Google cites in AIOs looks very different from what ranks on page 1 organically. For finance brands, organic rankings and AIO visibility may require attention to different content signals.
The Non-Ranking Story: How Much Are AIOs Citing Sources Outside the Top 100?
Beyond the top-10 overlap, we also looked at how many AIO citations come from sources that don’t rank anywhere in the top 100 organic results. The year-over-year trend shows AIOs becoming somewhat more aligned with organic rankings overall — but the gap remains large in many verticals:
| Industry | % Not in Top 100 (Last Year) | % Not in Top 100 (Today) | Change |
| Healthcare | 26.4% | 22.5% | -3.8pp |
| B2B Tech | 35.2% | 28.1% | -7.1pp |
| Insurance | 39.0% | 28.3% | -10.8pp |
| Education | 31.1% | 28.2% | -2.8pp |
| Entertainment | 92.2% | 46.6% | -45.6pp |
| Travel | 85.9% | 47.8% | -38.1pp |
| eCommerce | 92.9% | 61.5% | -31.3pp |
| Finance | 82.0% | 65.7% | -16.3pp |
| Restaurants | 88.3% | 76.0% | -12.3pp |
The overall trend is clear: AIOs are becoming more connected to organically-ranking content across the board. But in verticals like Finance (66%), eCommerce (62%), and Restaurants (76%), the majority of AIO citations still come from sources that don’t rank anywhere in the top 100 organic results. These are fundamentally different content sets.
What This Means for Your Search Strategy
- Organic Still Runs the Majority of Search
With approximately 52% of queries triggering no AI Overview at all, organic rankings remain the primary visibility channel for most search activity. The fundamentals — content quality, technical health, topical authority — are the foundation everything builds on.
- When AIOs Appear, They Dominate the Screen
An average AIO now exceeds 1,200 pixels — taller than a standard visible screen. The first organic result sits below the fold. For queries where AIOs are present, click-through rates to organic results are under pressure regardless of ranking position.
- Page-1 Rankings and AIO Citations Are Connected — But Not the Same
Only about 17% of AIO citations come from the organic top 10. Ranking #1 doesn’t guarantee AIO inclusion, and not ranking on page 1 doesn’t mean exclusion. Understanding your visibility across both organic and AIO experiences is essential.
- Your Industry Changes Everything
Healthcare sees 24% top-10 overlap. Finance sees 11%. The relationship between organic rankings and AIO citations is not universal — it’s vertical-specific. Brands need to understand how AIOs behave in their specific industry to make informed decisions.
- The Direction Is Toward More Alignment — But We’re Not There Yet
AIOs are gradually citing more content that also ranks organically, particularly in verticals like Travel, eCommerce, and Entertainment where overlap has grown significantly year over year. But even in the fastest-growing categories, 80%+ of AIO citations still come from outside the organic top 10. The gap is closing, but it’s still wide.
Technical Methodology
Data Source: BrightEdge AI Catalyst™, Generative Parser
Analysis Period: February 2025 – February 2026 (12-month tracking)
AIO Presence: Daily tracking of AI Overview triggering rates across tracked keyword set
AIO Pixel Height: Daily measurement of average AI Overview height in pixels
Citation Overlap: Weekly analysis of overlap between AIO-cited sources and organic ranking positions (top 10, top 100)
Industry Snapshots: Year-over-year comparison of citation overlap across nine verticals
Industries Covered: Healthcare, B2B Tech, Education, Insurance, Entertainment, Travel, eCommerce, Finance, Restaurants
Key Takeaways
- AIO Presence Has Grown Significantly: AI Overviews now trigger on approximately 48% of tracked queries, up from 30% a year ago — a 58% increase. At peak, more than half of all queries showed an AIO.
- But Organic Still Dominates: Approximately 52% of queries have no AI Overview. For the majority of search, traditional organic rankings are the entire user experience.
- AIOs Are Pushing Organic Below the Fold: Average AIO height now exceeds 1,200 pixels, up 15% year over year. On a standard screen, the first organic result sits below the fold when an AIO is present.
- AIO Citations and Page-1 Rankings Are Largely Different: Only about 17% of AIO-cited sources also rank in the organic top 10. This has been flat for months. The content AIOs cite is largely different from what users see on page 1.
- Industry Differences Are Dramatic: Healthcare sees 24% top-10 overlap. Finance sees just 11%. Travel grew from 6% to 18% year over year. Every vertical has a different relationship with AIOs.
- The Trend Is Toward More Alignment: AIOs are gradually citing more organically-ranking content, particularly in Travel, eCommerce, and Entertainment. But even in the fastest-moving verticals, 80%+ of citations still come from outside the top 10.
Download the Full Report
Download the full AI Search Report — AI Overviews at the One-Year Mark: Presence, Size, and What They’re Citing
Click the button above to download the full report in PDF format.
Published on February 12, 2026