18 Months of AI Overviews: What Healthcare Tells Us About Where Finance Is Headed
BrightEdge data reveals Google uses the same YMYL playbook for both industries. The difference isn't how Google treats them — it's how people search.
It's been 18 months since Google launched AI Overviews. We now have enough data to see patterns — and make predictions.
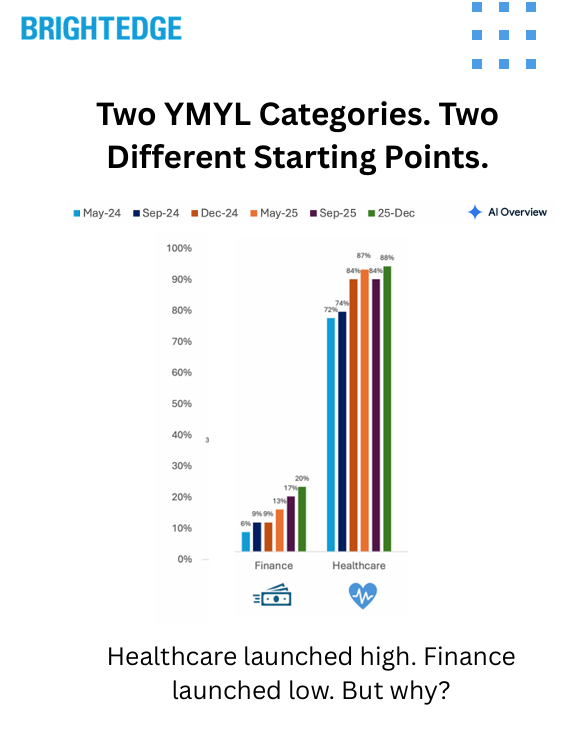
On the surface, Healthcare and Finance look completely different. Healthcare sits at 88% AI Overview coverage. Finance is at 21%. But 18 months of BrightEdge Generative Parser™ data reveals something deeper: Google applies the same logic to both categories. The gap isn't about how Google treats YMYL content — it's about how people search in these industries.
Data Collected
Using BrightEdge Generative Parser™, we analyzed AI Overview presence across Healthcare and Finance from May 2024 through December 2025 to understand:
- How AI Overview coverage evolved in each industry over 18 months
- Which query types saw the fastest expansion
- Where Google kept AI out — and why
- Whether the two YMYL categories follow the same underlying pattern
Key Finding
Google uses the same playbook for both industries. Finance just has a different query mix.
A large portion of Finance search is real-time queries — stock prices, tickers, market data. Healthcare doesn't have an equivalent. Google keeps AI out of real-time data for good reason: you need accuracy, not synthesis.
But when you compare similar query types — the educational, explainer, "help me understand" searches — the trajectory is nearly identical:
- Healthcare educational: 82% → 93% (near saturation)
- Finance educational: 16% → 67% (climbing fast)
Finance educational content is where Healthcare was 12-18 months ago. At current growth rates, Finance will reach Healthcare-level saturation (90%+) by late 2026.
The Headline Gap: Why Finance Looks So Different
At first glance, the numbers tell a simple story:
| Industry | May 2024 | December 2025 | Change |
| Healthcare | 72% | 88% | +16pp |
| Finance | 6% | 21% | +15pp |
Both industries grew roughly the same amount in absolute terms. But Healthcare started high; Finance started low.
The reason isn't Google's caution with financial content. It's the query mix.
Finance Query Composition
Finance search includes a massive real-time component that Healthcare simply doesn't have:
| Query Type | Example Keywords | % of Finance Queries | AIO Rate (Dec '25) |
| Stock Tickers | "AAPL stock price," "NASDAQ," "SPY" | ~70% | 8% |
| Educational | "what is a Roth IRA," "how do bonds work" | ~13% | 67% |
| Trading | "premarket futures," "stock market today" | ~4% | 44% |
| Tools/Calculators | "mortgage calculator," "401k calculator" | ~3% | 11% |
When someone searches "AAPL stock price," they don't need AI synthesis. They need a live price chart. Google's traditional SERP features — the stock widget, the market summary — already do this job perfectly.
Healthcare doesn't have an equivalent category. There's no "diabetes ticker" that needs real-time data. The vast majority of Healthcare searches are educational — symptoms, conditions, treatments — where AI synthesis adds genuine value.
The Parallel: Educational Queries Tell the Real Story
When you isolate educational queries in both industries, the pattern becomes clear:
Healthcare Educational (Specialty Care: Conditions, Symptoms, Treatments)
| Period | AIO Rate |
| May 2024 | 82% |
| September 2024 | 75% |
| December 2024 | 91% |
| May 2025 | 92% |
| September 2025 | 90% |
| December 2025 | 93% |
Healthcare launched high and reached near-saturation within 18 months.
Finance Educational (Tax, Retirement, Planning, Credit)
| Period | AIO Rate |
| May 2024 | 16% |
| September 2024 | 24% |
| December 2024 | 27% |
| May 2025 | 37% |
| September 2025 | 66% |
| December 2025 | 67% |
Finance educational started low but grew 51 percentage points in 18 months — accelerating sharply in 2025.
What This Means
The gap between Healthcare (93%) and Finance (67%) educational queries is now just 26 percentage points — down from 66 points in May 2024.
At Finance's current growth rate, educational content will reach 90%+ saturation by late 2026.
Where Google Expanded in Finance
The growth wasn't uniform. Some Finance categories exploded while others barely moved.
Biggest Movers (May 2024 → December 2025)
| Category | Example Keywords | May '24 | Dec '25 | Growth |
| Tax Planning | "tax brackets," "capital gains tax," "tax refund" | 0% | 63% | +63pp |
| Cash Management | "high yield savings account," "money market" | 13% | 79% | +67pp |
| Financial Planning | "mortgage rates," "CD rates," "compound interest" | 6% | 73% | +67pp |
| Credit & Debt | "student loan forgiveness," "how much house can I afford" | 5% | 62% | +57pp |
| Fixed Income | "treasury bills," "bond rates," "annuity" | 12% | 72% | +60pp |
| Retirement | "Roth IRA," "401k," "social security" | 33% | 61% | +28pp |
What Stayed Flat
| Category | Example Keywords | May '24 | Dec '25 | Growth |
| Stock Tickers | "AAPL stock," "SPY," "TSLA price" | 4% | 8% | +4pp |
| Brand/Navigational | "Fidelity," "Charles Schwab," "Vanguard" | 2% | 14% | +12pp |
The Pattern
Google went all-in on the same query types in Finance that it dominated in Healthcare: educational, explainer, planning content. The categories that grew fastest are the ones where AI synthesis genuinely helps users understand complex topics.
Meanwhile, Google kept AI out of real-time data and navigational queries — the same approach it takes in every industry.
Where Google Kept AI Out — In Both Industries
The most revealing pattern isn't where Google expanded. It's where Google deliberately kept AI out — and how consistent that logic is across both YMYL categories.
Local "Near Me" Queries
| Industry | Query Type | May '24 | Dec '25 |
| Healthcare | "doctor near me," "urgent care near me" | 0% | 11% |
| Finance | "bank near me," "financial advisor near me" | 0% | 20% |
Google tested AI Overviews on local queries in both industries — then pulled back. These queries belong to maps and local pack, not AI synthesis.
Real-Time Data
| Industry | Query Type | AIO Rate (Dec '25) |
| Finance | Stock tickers, market prices | 8% |
| Healthcare | N/A (no equivalent) | — |
Finance has a massive category of queries where real-time accuracy matters more than synthesis. Healthcare doesn't have an equivalent — which is why Healthcare's overall number is so much higher.
The Logic
Google applies the same framework everywhere:
- AI where synthesis adds value: Educational content, explainers, planning queries
- Traditional results where accuracy matters: Real-time data, local queries, navigational searches
The 18-Month Trajectory: Side by Side
Healthcare
| Period | Conditions/Symptoms | General Education | Local |
| May 2024 | 82% | 50% | 0% |
| September 2024 | 75% | 48% | 0% |
| December 2024 | 91% | 64% | 4% |
| May 2025 | 92% | 71% | 14% |
| September 2025 | 90% | 70% | 7% |
| December 2025 | 93% | 74% | 11% |
Finance
| Period | Educational | Real-Time (Tickers) | Local |
| May 2024 | 16% | 4% | 0% |
| September 2024 | 24% | 3% | 0% |
| December 2024 | 27% | 4% | 0% |
| May 2025 | 37% | 4% | 0% |
| September 2025 | 66% | 6% | 0% |
| December 2025 | 67% | 8% | 20% |
What This Means
The trajectories follow the same pattern:
- Educational content saturates first — Healthcare conditions hit 90%+ by December 2024; Finance educational is on the same path
- Local queries get tested, then pulled back — Both industries saw Google experiment with AI on "near me" queries, then reduce coverage
- Real-time/transactional stays flat — Stock tickers in Finance, navigational queries in both industries
Why This Matters: The Prediction
Based on 18 months of data across both YMYL categories, here's what we expect:
Finance Educational Content Will Hit 90%+ by Late 2026
Finance educational queries grew 51 percentage points in 18 months (16% → 67%). At this rate, saturation matching Healthcare (90%+) is 12-18 months away.
The Headline Gap Will Close
As Finance educational content saturates, the overall Finance AI Overview rate will climb toward Healthcare's level. The 67-point gap (21% vs 88%) will narrow significantly — not because Google is changing its approach, but because the query mix effect will diminish as more categories reach saturation.
Local Will Stay Local
Google tested AI Overviews on "near me" queries in both industries and pulled back. This is Maps territory. Don't expect AI to take over local search in YMYL categories.
Real-Time Will Stay Traditional
Stock tickers, market data, and live prices will remain in traditional SERP features. Google won't risk AI synthesis where accuracy matters most.
What This Means for Financial Services Marketers
1. Educational Content Is AI Territory — Optimize Now
Tax explainers, retirement planning guides, mortgage education, credit fundamentals — these query types are already at 60-70% AI Overview coverage and climbing. If you're not optimizing for AI visibility on educational content, you're ceding ground.
2. The Playbook Is Clear: Healthcare Shows the Way
Healthcare's trajectory is Finance's future. The categories that saturated first in Healthcare (conditions, symptoms, treatments) are analogous to what's saturating now in Finance (tax, retirement, planning). Look at where Healthcare is today to see where Finance will be in 12-18 months.
3. Real-Time and Local Are Different Games
If your strategy is focused on stock-related queries or local branch visibility, traditional SEO still applies. AI Overviews aren't taking over these spaces — Google is deliberately keeping them in specialized SERP features.
4. Track Query Intent, Not Just Industry Averages
The headline number (21% for Finance) is misleading. Educational Finance queries are already at 67%. Knowing which of YOUR queries fall into which category — and how AI Overview coverage is changing for each — is essential for strategy.
Technical Methodology
Data Source: BrightEdge Generative Parser™
Analysis Period: May 2024 through December 2025 (6 measurement points: May '24, September '24, December '24, May '25, September '25, December '25)
Sample Size:
- Finance: 2,580 keywords tracked consistently across all periods
- Healthcare: 2,760 keywords tracked consistently across all periods
Categorization:
- Finance queries categorized by L1/L2 taxonomy: Stocks & Trading, Finance & Investing (subdivided into Tax Planning, Retirement, Financial Planning, etc.), Tools, Brands
- Healthcare queries categorized by L1/L2 taxonomy: Specialty Care (Ortho, Neuro, Gastro, etc.), General Health, Primary Care
AI Overview Detection: Keywords classified as having AI Overview if Sge State ≠ "none"
Local Query Identification: Keywords containing "near me" flagged as local intent
Key Takeaways
Google Uses the Same YMYL Playbook for Healthcare and Finance: AI where synthesis adds value (educational content). Traditional results where accuracy matters (real-time data, local queries). The logic is identical across both industries.
The Gap Is About Query Mix, Not Google's Approach: Finance has a large real-time component (stock tickers) that Healthcare doesn't. Remove that from the equation, and the trajectories are nearly parallel.
Finance Educational Content Is Climbing Fast: 16% → 67% in 18 months. The acceleration in 2025 (37% → 67% in just 7 months) suggests Google has gained confidence in AI for financial education content.
Prediction: Finance Hits Healthcare Levels by Late 2026: Educational Finance content will reach 90%+ AI Overview coverage within 12-18 months, matching where Healthcare is today.
The Opportunity Is in Educational Content: For financial services marketers, the path is clear: educational, explainer, and planning content is where AI Overviews are expanding. Optimize for these query types now — before saturation makes it harder to earn visibility.
Download the Full Report
Download the full AI Search Report — 18 Months of AI Overviews: What Healthcare Tells Us About Where Finance Is Headed
Click the button above to download the full report in PDF format.
Published on January 29, 2026