
How Different AI Search Engines Choose Which Brands to Recommend
We analyzed tens of thousands of prompts across ChatGPT, Perplexity, and Google’s AI systems using BrightEdge AI Catalyst—revealing key differences in how each AI cites and prioritizes brands, with major implications for marketers in 2025 and beyond.
Data Collected: Monitored brand mention and citation patterns across four major AI platforms using BrightEdge AI Catalyst to analyze:
- Brand mention rates by engine and industry
- Citation source preferences and domain diversity
- Prompt patterns that trigger brand visibility
- Industry-specific behavioral differences
- Holiday and seasonal query performance
Key Finding: Each AI engine has a distinct "personality" that determines brand visibility. ChatGPT mentions brands in 99.3% of eCommerce responses while Google AI Overview includes them in just 6.2%. These aren't random variations—they're fundamental design differences that shape how customers discover products.
The Big Numbers
- 99.3% of ChatGPT eCommerce responses include brands
- 6.2% of Google AI Overview responses mention brands
- 41.3% of ChatGPT citations go to retail/marketplace domains
- 62.4% of Google AI Overview citations go to YouTube
- 8,027 unique domains cited by Perplexity (most diverse)
- 2,127 unique domains cited by ChatGPT (most concentrated)
Brand Mention Patterns by Engine
The Brand Maximizer: ChatGPT
- 5.84 average brands per eCommerce response
- 99.3% of responses include brand mentions
- 24 maximum brands in a single response
- Heavily favors established retail giants
- Amazon appears in 61.3% of citations
The Minimalist: Google AI Overview
- 0.29 average brands per eCommerce response
- 6.2% of responses include any brands
- 19 maximum brands in a single response
- Appears alongside organic results that handle commercial intent
- Prioritizes educational content over brand listings
The Balanced Performer: Google AI Mode
- 5.44 average brands per eCommerce response
- 81.7% of responses include brands
- 30 maximum brands in a single response
- Strong preference for brand/OEM sites (15.2% of citations)
- Balances commercial and informational content
The Citation Champion: Perplexity
- 4.37 average brands per eCommerce response
- 85.7% of responses include brands
- 45 maximum brands in a single response
- 8.79 average citations per response (highest)
- Most diverse source pool with 8,027 unique domains
Domain Citation Patterns
Where Each Engine Gets Its Information
Retailer/Marketplace Dominance:
- ChatGPT: 41.3% (Amazon, Target, Walmart lead)
- Perplexity: 21.2% (more balanced distribution)
- Google AI Mode: 14.5%
- Google AI Overview: 4.7%
Social/Community Reliance:
- Google AI Overview: 12.3% (YouTube 62.4%, Reddit 25.4%)
- Google AI Mode: 4.6%
- Perplexity: 4.6%
- ChatGPT: 0.4% (almost never cites social)
Brand/OEM Sites:
- Google AI Mode: 15.2% (highest brand site preference)
- ChatGPT: 5.5%
- Perplexity: 4.1%
- Google AI Overview: 2.6%
The "Other" Category: 48-77% of citations come from specialized sites beyond major platforms—industry publications, niche experts, and topic-specific resources. This long tail represents significant opportunity for specialized content creators.
Winning Prompt Patterns
Keywords That Trigger Maximum Brand Mentions
- "Budget/Affordable/Cheap" → 6.3-8.8 brands per response
- "Best/Top" rankings → 4.7-6.2 brands per response
- "Deals/Sales/Discount" → 6.2-8.3 brands per response
- "Buy/Shop/Purchase" → 5.8-7.8 brands per response
- "Compare/vs/versus" → 4.5-5.8 brands per response
Holiday Performance Boost
- Holiday-specific prompts generate 12% more brand mentions
- Gift queries average 6.5 brands vs 5.8 for general queries
- Perplexity delivers 9.4 citations for holiday searches
- Deal/discount queries see the highest brand density
Industry Variations
While our analysis focused on eCommerce, the behavioral patterns persist across industries:
- B2B Tech: High brand mentions for software comparisons
- Healthcare: Conservative brand mentions, higher citation requirements
- Finance: Institution names and product brands prominent
- Restaurants: Chain brands dominate mentions
- Travel: Hotels, airlines, booking platforms as primary brands
Strategic Takeaways
Understanding Engine Behaviors
ChatGPT treats most commercial queries as requiring comprehensive brand options. It prioritizes being helpful through extensive listings rather than selective recommendations.
Google AI Overview intentionally minimizes commercial content, relying on organic results for transactions while using AI for educational guidance.
Perplexity balances brand mentions with extensive source citations, appealing to research-oriented users who value transparency.
Google AI Mode strikes a middle ground, providing substantial brand information while maintaining source credibility.
The Market Context
While Google maintains 90% of search market share, these emerging AI engines influence high-value customers during research phases. ChatGPT and Perplexity users often represent early adopters and decision-makers who turn to AI for comprehensive analysis rather than simple searches.
Optimization Priorities
- Don't pick favorites - Optimize for all engines with a unified strategy
- Ensure retail presence - Major marketplaces are crucial for ChatGPT visibility
- Build authority content - Perplexity rewards comprehensive, citable resources
- Leverage video - YouTube dominates Google AI Overview citations
- Target trigger keywords - "Budget," "best," and comparison terms guarantee mentions
- Monitor the long tail - 48-77% of citations come from specialized sites
The 2025 Opportunity
The data reveals clear patterns: certain keywords trigger predictable brand mention rates, specific content types earn more citations, and each engine has distinct preferences. Brands that understand these patterns can optimize once but win everywhere—ensuring visibility regardless of which AI engine customers choose.
The surprise finding? Review sites perform equally across all engines (3.6-5.3% of citations), suggesting this content type transcends individual engine preferences. Meanwhile, most brands haven't yet adapted to these behavioral differences, creating significant first-mover advantage for those who act now.
.png)
Strategic Insight:
These aren't competing platforms requiring separate strategies—they're complementary channels that serve different user intents. ChatGPT provides comprehensive options, Google AI Overview offers educational context, Perplexity delivers researched recommendations, and Google AI Mode balances both needs. Success means ensuring your brand appears in the formats each engine trusts: retail feeds for ChatGPT, YouTube content for Google AI Overview, authoritative guides for Perplexity, and strong brand sites for Google AI Mode.
Monitor your performance across all engines using AI Catalyst, optimize for high-impact keywords in your industry, and remember—with holiday shopping approaching, the brands that understand these patterns will capture disproportionate visibility in AI-driven purchase decisions.
Download the Full Report
Download the full AI Search Report —How Different AI Search Engines Choose Which Brands to Recommend
Click the button above to download the full report in PDF format.
Published on October 17, 2025
How Different AI Search Engines Choose Which Brands to Recommend
AI Didn't Kill SEO—It Made Excellence in Fundamentals More Important Than Ever
We tracked tens of thousands of keywords from 2022-2025. The data reveals that top-ranking pages aren't abandoning SEO—they're executing it better than ever before.
Data Collected:
Tracked performance metrics for tens of thousands of keywords from 2022–2025 using BrightEdge SearchIQ to analyze how top-ranking pages evolved across:
- On-page optimization
- Schema implementation
- Technical performance
Key Finding:
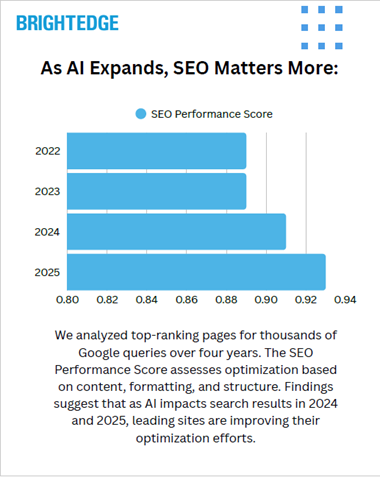
Top-ranking pages doubled schema usage when ChatGPT launched, improved performance scores by 20% despite pages becoming 43% heavier, and achieved 97% schema adoption by 2025—proving SEO fundamentals matter more than ever in the AI era.
The Big Numbers
- 97% of top results now use schema markup (up from 93%)
- 2X increase in structured data usage (9.6 → 18.5 schemas per SERP)
- 20% improvement in performance scores
- 50% faster interactivity (FID)
- 32% improvement in server response times
The Evolution Timeline
2022: The Baseline
- Pre-ChatGPT era
- Avg. 9.6 schemas per SERP
- SEO Score: 0.89
- Performance Score: 0.426
2023: The Explosion
- ChatGPT goes mainstream (Nov 2022)
- Schema usage nearly doubles overnight
- First signs of content evolution
2024: The Refinement
- Google AI Overviews launch (May)
- Technical optimization accelerates
2025: The New Normal
- 97% schema adoption
- SEO Score: 0.92
- Performance Score: 0.512
Takeaways from Data
- Structured Data Became Non-Negotiable
When ChatGPT launched in late 2022, schema markup usage nearly doubled within months. Top pages now average 17+ schema types vs. just 9 in 2022. This isn’t coincidence—it’s adaptation. - Technical Excellence Drives Rankings
Despite pages becoming 43% heavier, performance scores improved 20%. Server response times improved 32%, interactivity improved 50%, and Core Web Vitals became a competitive differentiator. - Quality Beats Quantity
Content got 13% shorter while SEO scores improved. Pages grew 18% larger in file size while reducing word count. The message: focused, structured, technically excellent content outperforms long-form keyword stuffing.
Download the Full Report
Download the full report — complete data, benchmarks, and insights to guide your AI search strategy.
Click the button above to download the full report in PDF format.
Published on September 04, 2025
AI Didn't Kill SEO—It Made Excellence in Fundamentals More Important Than Ever
AI Overviews Just Grew 43.6% in Ecommerce Searches—Your Holiday Strategy Needs Both AI and Organic Tactics
We analyzed how Google's AI Overviews expanded across ecommerce searches during September using BrightEdge Generative Parser™. The 43.6% surge wasn't random—it reveals Google's strategic deployment ahead of the critical holiday shopping season.
Data Collected: Monitored AI Overview presence across ecommerce keywords from September 7-30, 2025 using BrightEdge Generative Parser™ to analyze:
Coverage changes by category
Query type patterns
Search volume distribution
Category-level deployment strategies
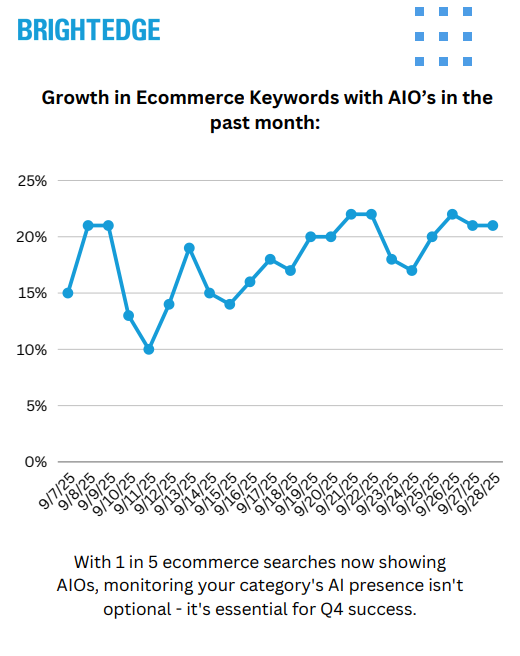
Key Finding: AI Overview presence jumped from 14.4% to 20.7% of ecommerce queries in just 23 days—but the expansion targeted specific product queries while leaving comparison and review content untouched, creating distinct optimization paths for different content types.
The Big Numbers
43.6% growth in AI Overview presence (Sept 7-30)
20.7% of ecommerce searches now show AI Overviews (up from 14.4%)
32% of new AI Overviews concentrated in Home products
0% new AI Overview coverage for review keywords
2.8 words average query length for new AI Overviews
The Category Breakdown
Where AI Overviews Are Expanding
Home Products
32% of all new AI Overview expansion
Focus on appliances and comfort items
High gift potential for Q4
Apparel
28% of new AI Overview coverage
Specific clothing items vs. categories
Mid-volume search terms dominate
Small Kitchen Appliances
13% of expansion
Air fryers leading coverage
Perfect timing for holiday gifting
Electronics
High-value products like iPhone 13
Specific model searches vs. category terms
Gift-worthy items prioritized
Where Traditional Organic Still Dominates
Review Content
0% new AI Overview deployment
Complete preservation of organic results
Safe territory for investment
Comparison Queries
"X vs Y" searches remain organic-only
No AI Overview growth detected
Traditional SEO tactics still win
"Best Of" Content
94% remain without AI Overviews
Buying guides stay in organic results
Minimal disruption risk
Query Patterns That Trigger AI Overviews
High AI Overview Presence
Product-Specific Searches
"What are good air fryers"
"What is the latest iPhone"
Direct product information queries
79% of all new AI Overviews
Mid-Volume Keywords
10K-100K monthly searches
Sweet spot for AI deployment
Lower competition than head terms
Higher intent than long-tail
Short Product Queries
Average 2.8 words
Not long-tail, not head terms
Specific but accessible
Natural language patterns
Low/No AI Overview Presence
High-Volume Head Terms
Category-level searches
Minimal AI Overview coverage
Traditional SEO battleground
Preserved for organic competition
Review-Focused Queries
"[Product] reviews"
User opinion searches
100% organic results
No AI interference
Comparison Content
Versus queries
Alternative searches
Evaluation intent
Pure organic territory
Takeaways from Data
Google's Surgical Deployment: The 43.6% growth isn't universal—it's concentrated in gift-worthy categories (Home, Apparel, Electronics) while completely avoiding review and comparison content.
Two-Track Optimization Required: Product pages need AI Overview optimization while comparison/review content should focus on traditional organic rankings—they're not competing for the same visibility.
Mid-Tail Opportunity: Google favors 10K-100K search volume keywords with 2-3 word queries—not head terms or long-tail. This sweet spot represents the best ROI for AI Overview optimization.
Review Content Safe Haven: With 0% new AI Overview coverage on review keywords and comparison queries, these content types remain pure organic plays—invest confidently without AI disruption concerns.
Holiday Timing Not Coincidental: The September surge in gift categories (appliances, electronics, apparel) signals Google's preparation for holiday shopping queries. Brands need visibility strategies for both AI and organic formats.
Strategic Insight:
Your ecommerce holiday strategy doesn't need an overhaul, but it does need awareness. With 1 in 5 ecommerce searches now showing AI Overviews, understanding where they appear—and where they don't—becomes critical for Q4 success.
The data reveals Google is creating specialized lanes: AI Overviews for quick product information, traditional organic for research and evaluation. Brands that recognize this division can optimize accordingly rather than applying blanket strategies.
Monitor your product pages for AI Overview presence, protect your comparison content's organic rankings, and remember—the SERP isn't becoming simpler, it's giving you more inroads to reach your customers.
Download the Full Report
Download the full AI Search Report — AI Overviews Just Grew 43.6% in Ecommerce Searches—Your Holiday Strategy Needs Both AI and Organic Tactics
Click the button above to download the full report in PDF format.
Published on October 2, 2025
AI Overviews Just Grew 43.6% in Ecommerce Searches—Your Holiday Strategy Needs Both AI and Organic Tactics
Google's AI Overview Rollout Reveals Clear Intent Hierarchy—Here's What Gets Coverage and What Doesn't
We tracked AI Overview deployment across 9 industries for 16 months. The data reveals Google's strategic pattern: prioritizing informational queries while protecting commercial intent.
Data Collected: Monitored AI Overview coverage across 9 industries from May 2024-September 2025 using BrightEdge Generative Parser™ to analyze:
- Industry adoption rates
- Query intent patterns
- Subcategory performance
- Rollout phases
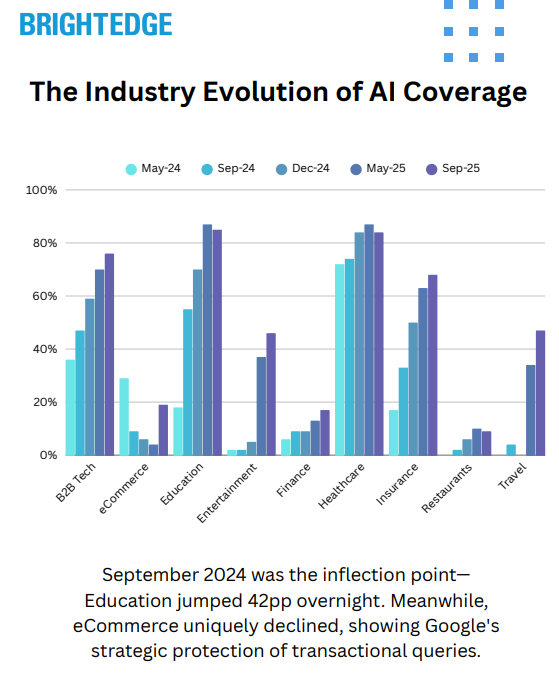
Key Finding: AI Overview coverage grew from 26.6% to 44.4% overall, but the real story is the intent hierarchy—Healthcare hits 83.6% with informational queries while eCommerce declined to 18.5% as Google protects transactional searches.
The Big Numbers
- 44.4% of queries now show AI Overviews (up from 26.6%)
- 5.5X growth in Education (15.4% → 85.2%)
- 100% AI Overview adoption in technical subcategories
- -8.7pp decline in eCommerce (only declining industry)
- <20% coverage for Finance & Restaurants
The Rollout Timeline
May 2024: Strategic Launch
- Healthcare leads at 67.6%
- B2B Tech at 34.2%
- eCommerce at 27.2%
- Focus on high-trust informational queries
September 2024: Public Rollout
- Education explodes (+42pp overnight)
- Insurance surges (+22pp)
- eCommerce drops to 8.8%
- Clear pivot to educational content
December 2024: Expansion
- Travel accelerates (8.1% → 36.9%)
- Healthcare reaches 84.2%
- Commercial queries remain suppressed
September 2025: Current State
- Education dominates at 85.2%
- Entertainment emerges at 45.9%
- eCommerce rebounds slightly to 18.5%
- Finance still minimal at 17.9%
The Intent Hierarchy
High Coverage (60-85%)
- "What is/How does" queries
- Medical definitions & symptoms
- Technical documentation
- Educational concepts
- Research comparisons (non-transactional)
Low Coverage (<20%)
- "Buy X online" queries
- Local commercial searches
- Financial advice
- Direct brand navigation
- Pure transactional intent
Takeaways from Data
- Google Protects Commercial Revenue eCommerce's decline from 27.2% to 18.5% reveals Google's strategy—AI Overviews appear where they add value without threatening ad revenue. Transactional queries remain in traditional SERP format.
- Specialized Knowledge Wins Subcategories with 100% adoption (CI/CD, Security Management, Ophthalmology) share three traits: high informational value, low commercial intent, and specialized expertise required.
- Industry Patterns Predict Opportunity Three clear patterns emerged:
- Early Adopters (Healthcare, B2B Tech): Started strong, steady growth
- Transformation Stories (Education, Insurance): Explosive growth after public rollout
- Late Bloomers (Entertainment, Travel): Minimal start, recent acceleration
- The September 2024 Inflection Public rollout triggered massive shifts—Education jumped 42pp overnight. This marks when Google found its sweet spot: high-value informational content with zero ad conflict.
Download the Full Report
Download the full report — complete industry data, rollout benchmarks, and insights to guide your AI Overview strategy.
Click the button above to download the full report in PDF format.
Published on September 11, 2025
Google's AI Overview Rollout Reveals Clear Intent Hierarchy—Here's What Gets Coverage and What Doesn't
LinkedIn Learning and Pulse Articles Emerge as Top AI Citation Sources for B2B Content
We analyzed how AI engines cite LinkedIn content across ChatGPT, Google AI Overview, and Perplexity using BrightEdge AI Catalyst. The results reveal a massive 2026 opportunity for B2B marketers who understand which LinkedIn formats AI engines trust.
Data Collected: Monitored LinkedIn content performance across major AI platforms using BrightEdge AI Catalyst to analyze:
Citation rates by content type
Platform-specific preferences
Week-over-week growth patterns
Content format effectiveness
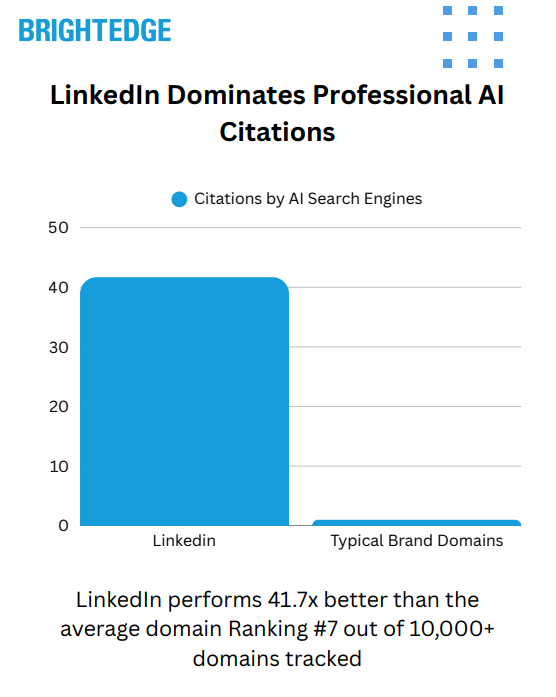
Key Finding: LinkedIn performs 41.7x better than the average domain for AI citations—yet 98% of LinkedIn content gets zero AI visibility. The 2% that breaks through follows strict patterns: LinkedIn Learning courses and educational Pulse articles dominate, while social posts, company updates, and thought leadership are completely ignored.
The Big Numbers
41.7x better performance than average domain
100% week-over-week growth in Pulse article citations
9x more LinkedIn citations on Google AI vs ChatGPT
0% citations for company posts and status updates
2% of LinkedIn content actually gets cited by AI
The Content Type Breakdown
Where LinkedIn Gets AI Citations
LinkedIn Learning
Highest performing content type across all platforms
Preferred by ChatGPT for educational queries
Curated, trusted educational resource
Evergreen visibility that compounds
Pulse "How-To" Articles
Growing 100% week-over-week
Dominates Google AI Overview citations
Financial and professional guides perform best
Educational format critical for success
Where LinkedIn Gets ZERO Citations
Social Content
Company page posts
Personal status updates
Employee spotlights
Event recaps
Engagement Content
Thought leadership posts
Industry hot takes
Poll questions
Viral content attempts
Promotional Content
Product announcements
Partnership news
"We're hiring" posts
Award celebrations
AI Platform Preferences for LinkedIn
High LinkedIn Citation Platforms
Google AI Overview
9x more citations than ChatGPT
Strong preference for Pulse articles
Emerging focus on Advice/Q&A content
Delivers majority of LinkedIn's AI visibility
ChatGPT
Prefers LinkedIn Learning courses
Main domain citations
Ignores Pulse articles
Educational content focus
Low LinkedIn Citation Platforms
Perplexity
Ultra-selective approach
Only 1.6% of LinkedIn URLs cited
Specific how-to content preference
Minimal overall presence
Google AI Mode
Near-zero LinkedIn citations
0.06% success rate
Not a priority for optimization
Focus efforts elsewhere
Query Patterns That Surface LinkedIn
High LinkedIn Visibility Queries
"How to choose a financial advisor"
Professional development paths
Career transition strategies
B2B marketing techniques
Business strategy frameworks
Industry-specific tutorials
Technical skill training
Leadership development
Zero LinkedIn Visibility Queries
Consumer product searches
Entertainment content
Health and medical queries
Recipe and cooking content
Local business searches
Weather and news
General how-to (non-professional)
Shopping comparisons
Takeaways from Data
LinkedIn Learning's Hidden Value: While becoming an instructor requires significant effort—application, collaboration, scripted content—the ROI is substantial. Your course joins LinkedIn's most AI-visible content category with guaranteed placement and payment.
The Pulse Article Formula: Only educational, guide-style Pulse articles get citations. The 100% weekly growth suggests early movers in 2026 could establish lasting advantages. Focus on "how-to" formats over thought leadership.
Platform Strategy Matters: Google AI Overview delivers the vast majority of LinkedIn citations. Optimize for Google's preferences (Pulse articles) while maintaining LinkedIn Learning content for ChatGPT visibility.
Social Content's AI Invisibility: Traditional LinkedIn engagement tactics—posts, updates, viral content—are completely invisible to AI engines. This doesn't mean abandon them, but recognize they serve different purposes than AI discovery.
The 2026 Opportunity: With explosive weekly growth and clear content preferences emerging, B2B marketers who adapt their LinkedIn strategy for AI visibility could capture significant competitive advantage.
Strategic Insight:
Your LinkedIn strategy doesn't need an overhaul, but it needs evolution. While your current content drives engagement and community, adding AI-optimized formats establishes your brand as an authoritative source that answer engines trust.
The data reveals LinkedIn has secured its position as a top-tier source for professional content—ranking among the top domains tracked. But success requires understanding that AI engines treat LinkedIn as a professional knowledge library, not a social network.
Monitor your LinkedIn content performance in AI Catalyst, test educational formats alongside your regular content, and remember—early movers in this rapidly growing space could establish lasting visibility advantages.
Download the Full Report
Download the full AI Search Report — LinkedIn Learning vs Pulse: Which Content Gets AI Citations Across Major AI Engines
Click the button above to download the full report in PDF format.
Published on October 9, 2025
LinkedIn Learning vs Pulse: Which Content Gets AI Citations - BrightEdge Research
ChatGPT Citation Volatility Analysis: Baseline Data Before GPT-5
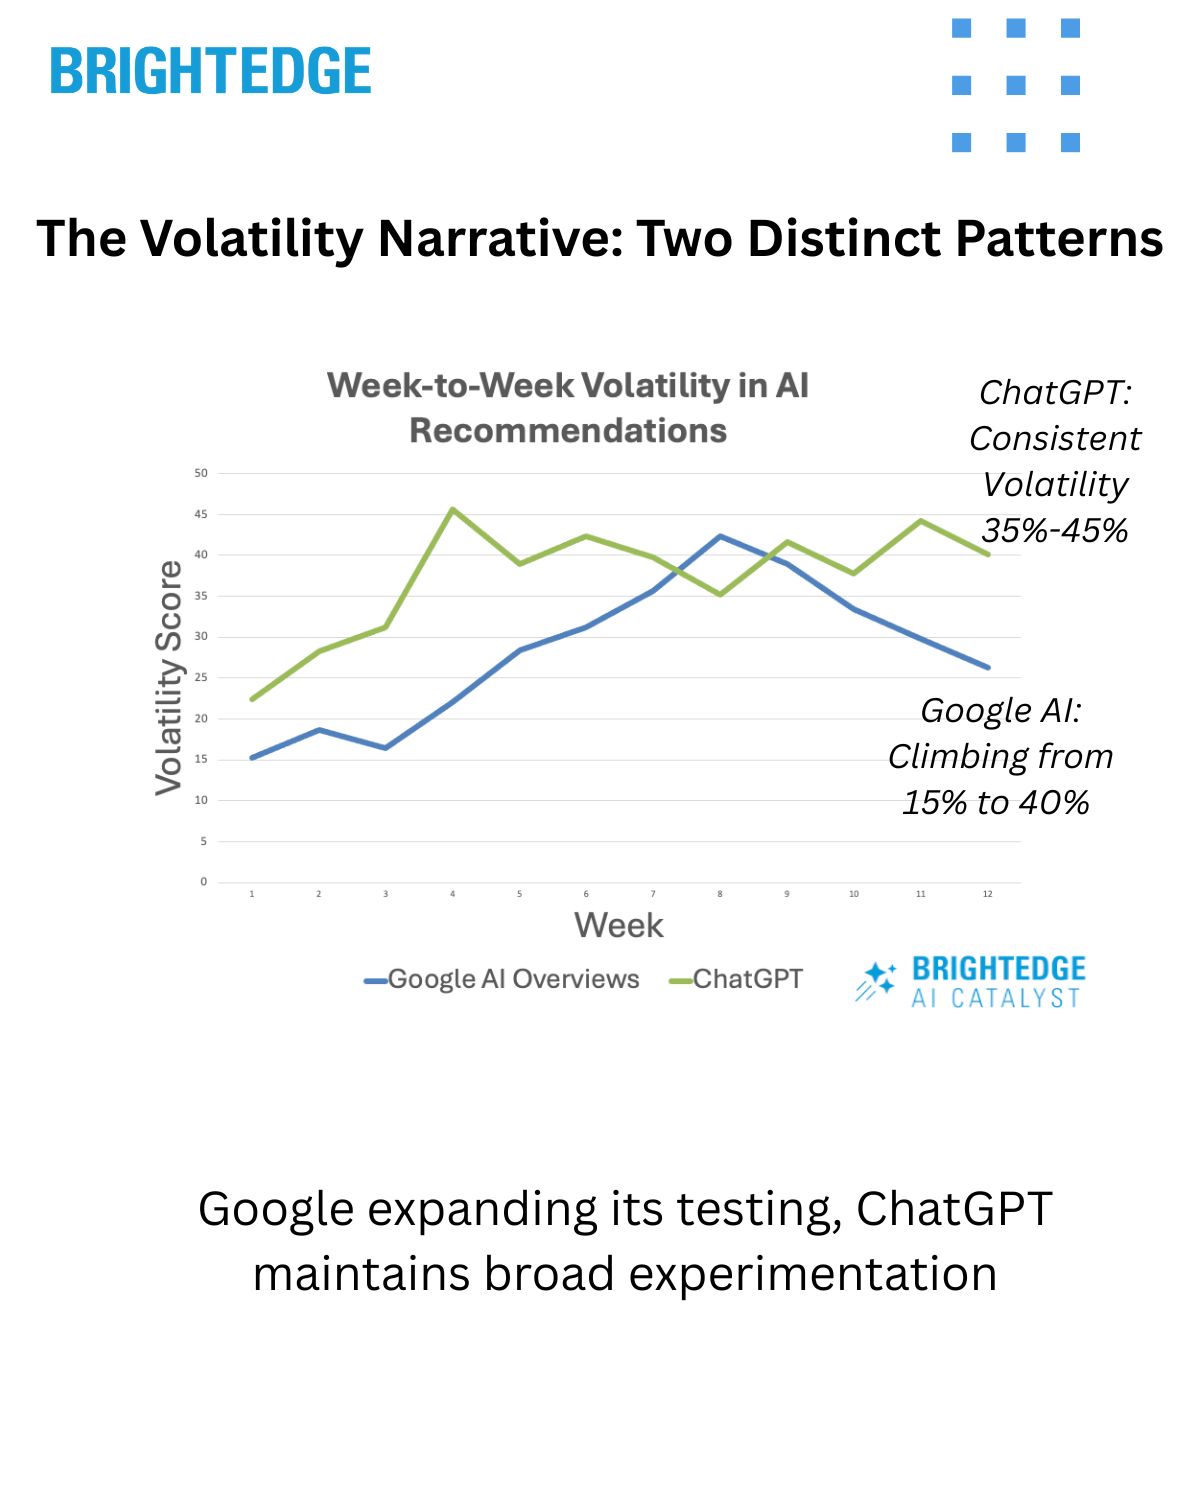
ChatGPT maintains consistent high volatility (35-45%) while Google AI Overviews shows increasing instability (climbing from 15% to 40%+), revealing distinct platform testing patterns.
Data Collected: Analyzed thousands of URLs cited by ChatGPT-4 and compared volatility patterns with Google AI platforms
Key Finding: ChatGPT maintains consistent high volatility (35-45%) while Google AI Overviews shows increasing instability (climbing from 15% to 40%+), revealing distinct platform testing patterns
ChatGPT Citation Concentration:
- Top 20% of domains capture 67% of all citations
- 34% of URLs experience >50% weekly citation changes
- Individual URL swings range from -60% to +400%
- Platform maintains steady volatility range despite extreme individual swings
Extreme Volatility Examples (100-400% swings):
- Major retailers: Macy's (+150%), Apple (+200%), Rakuten (+400%)
- Educational platforms: Coursera (+200%), showing even trusted categories aren't immune
- Specialty retail and niche tools showing highest volatility
- Week-over-week changes can quadruple citations or eliminate them entirely
Platform Comparison Patterns:
- Google AI: Progressive volatility increase suggests active algorithm evolution
- ChatGPT: Consistent high volatility indicates established testing framework
- Both platforms actively refining citation signals but through different approaches
Download the Full Report
Download the full report — baseline volatility data, platform comparisons, and insights to guide your AI search strategy before GPT-5.
Click the button above to download the full report in PDF format.
Published on August 14, 2025
ChatGPT Citation Volatility Analysis: Baseline Data Before GPT-5
ChatGPT Brand Mentions vs. Citations: What Triggers Visibility
ChatGPT mentions brands 3x more than it cites them, signaling a shift from links to recommendations. Commercial queries drive far higher visibility than informational ones.
Data Collected: Analysed thousands of ChatGPT prompts using BrightEdge AI Catalyst to compare brand mentions, citations, and trigger words
Key Finding: ChatGPT mentions brands 3.2x more than it cites them. Nearly half of prompts contain zero brand mentions, but commercial intent language (e.g., “deals,” “where to buy”) drives 4–8x higher mentions than informational queries.
ChatGPT Brand Mention Patterns:
- 2.4 average brand mentions per prompt
- 44% of prompts = zero brand mentions
- Only 3% of prompts = 10+ brand mentions
- 0.74 citations per prompt → unlinked recommendations dominate
- “Best” queries = 4.8 mentions (2x higher than baseline), but 25% still return zero brands
Trigger Word Impact:
- High performers: “where,” “find,” “cheap,” “deals,” “affordable”
- Moderate: “best” (popular but inconsistent)
- Low performers: “how,” “what,” “cost”
Examples:
- “Best Cyber Monday electronics deals” → 21 mentions
- “Best Prime Day deals” → 20 mentions
- “Educational tools/tech queries” → 17–21 mentions
- Transactional queries outpace informational by 8–10x
Platform Recommendation Patterns:
- Mentions are more stable than citations, reducing volatility risk
- Commercial queries consistently outperform informational ones
- Educational and deal-related queries produce unexpected visibility opportunities
Download the Full Report
Download the full report — brand mentions vs. citations, trigger words, and strategies to boost AI visibility.
Click the button above to download the full report in PDF format.
Published on August 14, 2025
ChatGPT Brand Mentions vs. Citations: What Triggers Visibility
AI Overview Citations Now 54% from Organic Rankings
16-month study reveals AI Overview citations increasingly overlap with organic rankings, growing from 32% to 54%. See industry breakdowns and strategy tips.
Data Collected: Monitored AI Overview citation overlap with organic rankings across 9 industries from May 2024-September 2025 using BrightEdge Generative Parser™ to analyze:
- Citation source patterns
- Overlap progression over time
- Industry-specific convergence rates
- Algorithm evolution phases
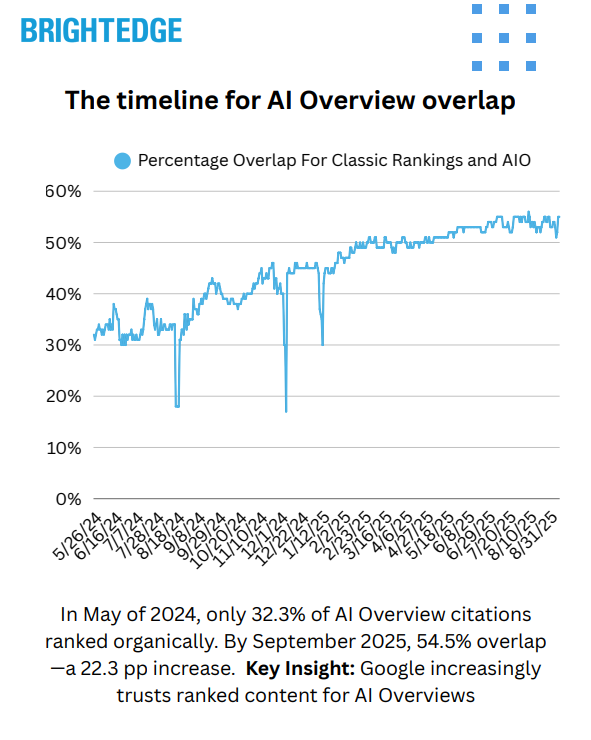
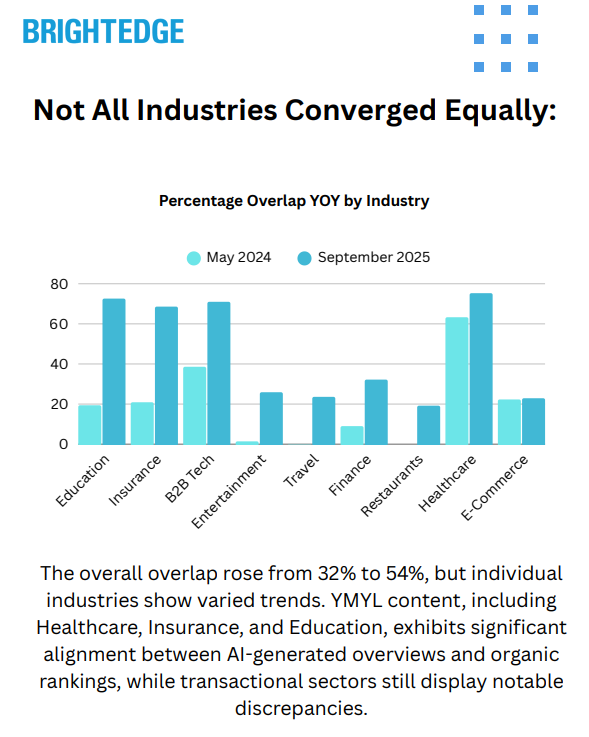
Key Finding: AI Overview citations increasingly come from pages that rank organically—overlap grew from 32.3% to 54.5% (+22.3 pp), but individual industries vary wildly from E-commerce's flat 0.6 pp change to Education's massive 53.2 pp surge.
The Big Numbers
- 54.5% of AI Overview citations now rank organically (up from 32.3%)
- 69% relative increase in overlap over 16 months
- 53.2 pp increase for Education (largest industry shift)
- 0.6 pp increase for E-commerce (only flat industry)
- 75%+ overlap for Healthcare and Education (highest convergence)
The Convergence Timeline
May 2024: Launch Baseline
- Overall overlap: 32.3%
- Healthcare leads at 63.3%
- Travel/Entertainment/Restaurants near 0%
- Most citations from non-ranking sources
September 2024: Public Rollout Catalyst
- Overlap jumps to 39.1%
- Acceleration begins (+5.4 pp in 2 months)
- Education and Insurance surge
- Clear shift toward ranked content
January 2025: New Year Acceleration
- Overlap reaches 45.2%
- Fastest growth period (~3 pp/month)
- Most industries showing convergence
- E-commerce remains flat
September 2025: Current State
- Overlap stabilizes at 54.5%
- Healthcare at 75.3%
- Education at 72.6%
- E-commerce still at 22.9%
- Pattern appears to be stabilizing
Industry Breakdown
High Convergence (68-75% overlap)
- Healthcare: 75.3% (started high, modest gains)
- Education: 72.6% (explosive +53.2 pp growth)
- B2B Tech: 71.0% (strong +32.4 pp growth)
- Insurance: 68.6% (major +47.7 pp surge)
Low Convergence (<33% overlap)
- Finance: 32.2% (steady but below average)
- Entertainment: 25.9% (late starter, catching up)
- Travel: 23.6% (started near zero)
- E-commerce: 22.9% (anomaly - virtually no change)
- Restaurants: 19.2% (started at zero)
The Three Phases
Phase 1: Testing (May-Aug 2024)
- Flat at ~32-34% overlap
- Google experimenting with sources
- Some industries had AIOs disabled
- No clear pattern emerging
Phase 2: Acceleration (Sep 2024-Jan 2025)
- 34.6% → 45.2% (+10.6 pp in 4 months)
- September public rollout triggers shift
- Fastest growth: ~3 pp per month
- Clear move toward ranked content
Phase 3: Convergence (Feb-Sep 2025)
- 45.2% → 54.5% (+9.3 pp)
- Crossed 50% threshold in May 2025
- Growth slowing, pattern stabilizing
Takeaways from Data
- The Convergence is Real but Uneven While overall overlap grew 22.3 pp, individual industries range from 0.6 pp (E-commerce) to 53.2 pp (Education). Your strategy depends entirely on your vertical.
- YMYL Content Drives Convergence Healthcare, Insurance, and Education show 68-75% overlap—when trust matters, Google strongly prefers content that already ranks well organically.
- E-commerce is the Exception The only industry where overlap stayed flat (0.6 pp) and AIO coverage actually decreased (-7.6 pp). Google appears to intentionally keep transactional queries separate from AI Overviews.
- Position 21-100 is the Sweet Spot Most overlap growth comes from pages ranking 21-100, not top 10. Only 16.7% of citations come from top 10 results, suggesting Google seeks diversity within ranked content.
- September 2024 Changed Everything The public rollout marked a clear inflection point—overlap jumped 5.4 pp in two months. This is when Google committed to favoring ranked content for AI Overviews.
Download the Full Report
Download the full AI Search Report — 16-month study reveals AI Overview citations increasingly overlap with organic rankings, growing from 32% to 54%. See industry breakdowns and strategy tips.
Click the button above to download the full report in PDF format.
Published on September 18, 2025