Google AI Overview Holiday Shopping Test: The 57% Pullback That Changes Everything
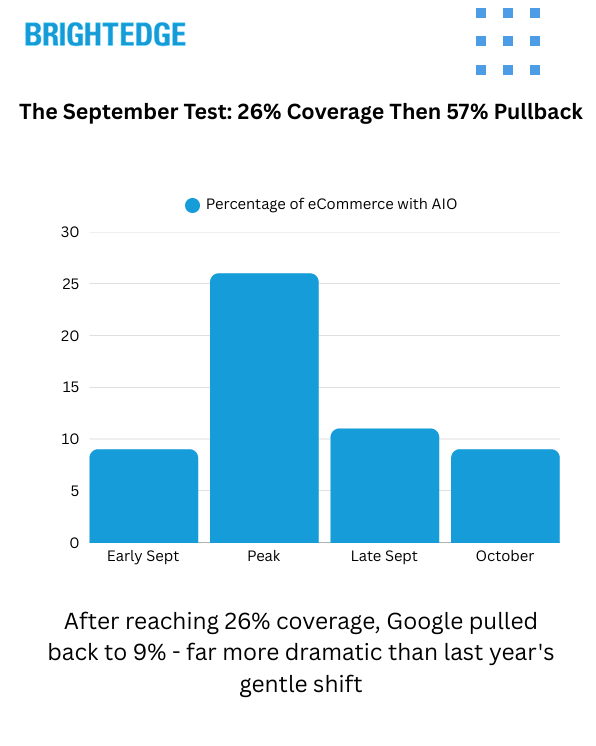
We tracked AI Overview across thousands of eCommerce keywords from September–October 2025. Coverage spiked from 9% to 26% on Sept 18, then pulled back to 9%—revealing Google’s holiday shopping strategy.
Data Collected: Analyzed AI Overview presence patterns across major ecommerce categories to understand:
- Daily percentage changes in AI Overview coverage
- Category-specific retention patterns
- Search volume correlation with AI Overview presence
- Year-over-year pattern changes
- Keyword intent and funnel stage analysis
Key Finding: Google retained only 30% of
AI Overviews at peak, with dramatic differences by category. Grocery maintained 56% retention while Furniture dropped to 3%—revealing a deliberate strategy to deploy AI where it adds value without disrupting commerce.
The September Spike Pattern
Coverage Timeline
- Sept 1-10: 9% baseline coverage
- Sept 11-18: Surged to 26% (peak on Sept 18)
- Sept 19-30: Rapid pullback to 11%
- Oct 1-15: Stabilized at 9%
The Magnitude Shift
- 2024: Gentle 5.6% reduction (321 → 303 keywords)
- 2025: Massive 56.8% reduction (741 → 320 keywords)
- 10x larger pullback year-over-year
The Category Hierarchy
Winners: High Retention Categories
Grocery & Food - 56% Retention
- Recipe queries maintained strong presence
- Ingredient information valued by AI
- Food preparation guidance prioritized
TV & Home Theater - 43% Retention
- Comparison content survived cuts
- "Best TV for [use case]" queries retained
- Technical specification explanations kept
Small Kitchen Appliances - 37% Retention
- "How to use" content preserved
- Product comparison queries maintained
- Feature explanation content retained
Losers: Low Retention Categories
Furniture - 3% Retention (97% removed)
- Visual shopping experience prioritized
- Traditional galleries preferred
- Limited informational value for AI
Home - 7% Retention (93% removed)
- Decorating queries removed
- Shopping-focused vertical
- Visual browsing emphasized
Apparel - 23% Retention (77% removed)
- Fashion requires visual discovery
- Size/fit better served by reviews
- Brand shopping preserved for traditional search
The Search Volume Revelation
2025's Complete Strategy Reversal
Unlike 2024, Google now retains higher-volume keywords:
- Retained keywords: 13,675 median search volume
- Removed keywords: 12,817 median search volume
- Ratio: 1.07x higher volume for retained
Volume Distribution
Removal rates were surprisingly uniform across volume quartiles:
- Q1 (Lowest): 71.5% removed
- Q2 (Med-Low): 73.1% removed
- Q3 (Med-High): 75.0% removed
- Q4 (Highest): 66.5% removed
The Intent Pattern
What Google Kept
Middle-Funnel Dominance
- 26.3% of retained keywords are evaluation/comparison queries
- "Best [product]" queries show 25% retention
- "X vs Y" comparisons maintained strong presence
Research & Learning
- "How to" queries retained where applicable
- Educational content about products preserved
- Comparison and evaluation prioritized
What Google Removed
Bottom-Funnel Purge
- Transactional keywords heavily removed
- Price-related queries eliminated
- Specific product names dropped
- "Buy" and "deals" queries removed
The Strategic Logic: AI Overviews help during research, step back during purchase
Holiday Predictions Based on Patterns
Expected November Behavior
If 2025 follows 2024's seasonal pattern:
- Current: 9% coverage
- November projection: 10-11% coverage
- Rationale: Research phase intensifies
Expected December Behavior
- December projection: 8-9% coverage
- Rationale: Purchase intent dominates
- Pattern: AI steps back for shopping season
The Opportunity Window
- November: Citation opportunities during research phase
- December: Traditional search dominates purchases
- Critical timing: Content must be ready NOW
Strategic Implementation Framework
For High-Retention Categories (>40%)
- Double down on comparison content
- Create comprehensive buying guides
- Build "best of" content for every segment
- Focus on educational material
For Medium-Retention Categories (20-40%)
- Test both AI and traditional optimization
- Monitor weekly for pattern changes
- Create topic clusters for stability
- Balance informational and transactional
For Low-Retention Categories (<20%)
- Prioritize traditional SEO tactics
- Focus on shopping feed optimization
- Invest in visual content
- Maintain product grid prominence
Universal Patterns Across Verticals
Despite category differences, certain patterns hold:
Content Types That Win
- Evaluation content ("best [product for use case]")
- Comparison content ("X vs Y")
- Educational content ("how to use")
- Higher search volume queries
Content Types That Lose
- Transactional queries
- Specific product searches
- Price-focused content
- Brand-specific queries
The 82% Reshuffling
Year-over-year keyword overlap: Only 18%
This massive reshuffling indicates:
- Google is actively experimenting
- Strategies must be flexible
- Historical performance doesn't guarantee future presence
- Monitoring is more critical than ever
Actionable Insights for SEO Professionals
Immediate Actions
- Audit your content: Identify evaluation vs transactional pages
- November priority: Get comparison content indexed NOW
- Category check: Assess your vertical's retention rate
- Volume analysis: Focus on 13K+ search volume keywords
Long-Term Strategy
- Dual approach: Win AI for research, traditional for transactions
- Content clusters: Build comprehensive topic coverage
- Monitor volatility: Weekly tracking through holidays
- Prepare for change: Only 18% YoY consistency
Technical Methodology
Data Sources:
- Daily AI Overview tracking Sept 1 - Oct 15
- Keyword-level analysis across ecommerce categories
- Search volume correlation analysis
- Category-specific retention calculations
Measurement Period: September 1 - October 15, 2024 and 2025
Analysis Tools: Manual tracking and proprietary monitoring systems
Key Takeaways
- The 57% Rule: Google pulled back 57% from peak, 10x more aggressive than 2024
- The Category Split: 56% retention (Grocery) vs 3% (Furniture) shows clear priorities
- The Volume Flip: Higher volume now retained (opposite of 2024)
- The Intent Filter: Research queries win, transactional queries lose
The 82% Shuffle: Only 18% keyword overlap year-over-year
Industry Implications:
This test reveals Google's dual strategy: Help users research with AI Overviews, preserve commercial intent for traditional results. The aggressive pullback suggests quality thresholds are higher than ever, while category-specific patterns show Google understands where AI adds vs. detracts from user experience.
For brands preparing for holiday shopping season, the message is clear: November is for research (AI Overviews), December is for buying (traditional search). Position your content accordingly.
Download the Full Report
Download the full AI Search Report — Google AI Overview Holiday Shopping Test: The 57% Pullback That Changes Everything
Click the button above to download the full report in PDF format.
Published on October 30, 2025