AI Agents for Search Marketers
Your website has a new set of visitors, and most marketing teams have no idea they are there. AI agents from OpenAI, Anthropic, Google, Apple, Perplexity, and others are crawling the web at scale, reading your content, and deciding in real time whether to cite it, summarize it, or skip it entirely. According to BrightEdge research, AI agent crawl activity across enterprise sites spans three distinct categories: agents crawling for training data, agents powering real-time search answers, and agents acting on behalf of individual users. Together they represent a new layer of traffic that are invisible for traditional analytics, responds to different signals than Googlebot, and increasingly determines where your brand appears in AI-generated answers.
This guide covers everything search marketers and digital teams need to understand about AI agents: who they are, what they crawl, how to make sure they can reach your content, and how to optimize for visibility in the AI-powered search landscape that is already here.
What Are AI Agents and Why Are They Different?
The term "AI agent" gets used loosely, which creates confusion for marketers trying to understand what is actually happening on their sites. For the purposes of search and content visibility, an AI agent is a crawler that navigates the web, retrieves and processes content, and uses what it finds to power AI technologies such as chatbots, search engines, research tools, or to train Large Language Models. The agent is not a user. It does not convert, it does not bounce, and it never shows up in your GA4 sessions report.
That last point is critical. Most of the traffic that AI agents generate is invisible in standard analytics because agents do not execute JavaScript, do not trigger client-side tracking tags, and do not carry session cookies. The most reliable way to see them is through server logs or a purpose-built intelligence layer such as BrightEdge's AI Agent Analytics.
How AI Agents Differ From Traditional Web Crawlers
Googlebot has been crawling the web since 1998. Marketing teams have spent decades learning to accommodate it: sitemaps, robots.txt, canonical tags, structured data. AI agents operate on a fundamentally different model. Understanding the differences is the starting point for optimization.
Purpose
Googlebot crawls to index and rank. AI agents crawl to understand, synthesize, and cite. But before that distinction matters, something more fundamental has to be true: the AI agent has to know your site exists, and it has to decide your pages are worth reading.
That determination starts with traditional search. Every major AI agent (GPTBot, ClaudeBot, Gemini, Perplexity) uses a traditional search index as part of its sourcing infrastructure. If your pages aren't indexed, aren't earning authority, and aren't signaling topical relevance through the fundamentals, you are invisible to AI agents before the question of citation ever comes up.
Traditional search visibility is the price of admission to AI search.
Once you're in the room, the signals diverge. A page that ranks in the top ten organic results will not automatically earn an AI citation, and a page that is frequently cited in AI-generated answers may not appear in the top ten at all. The overlap is real but incomplete, and understanding where it breaks down is where the optimization opportunity lives.
Content Consumption
Traditional crawlers primarily care about structure: title tags, headers, internal links, page speed. AI agents are trained on high-quality human-curated text, which suggests they respond to the same signals that make content worth reading: clear arguments, specific claims, credible sourcing. The exact weighting of those signals in citation selection is not publicly documented by any platform. What is observable is that content demonstrating genuine expertise on a topic consistently performs better in citation than content covering the same subject superficially.
JavaScript and Rendering
Most AI agents do not render JavaScript. If your key content, navigation, or product details live behind client-side rendering, a meaningful portion of AI agents simply cannot see it. This is not a theoretical risk. It is a structural gap that affects a large share of modern websites, particularly those running heavy frontend frameworks without server-side rendering.
Crawl Behavior
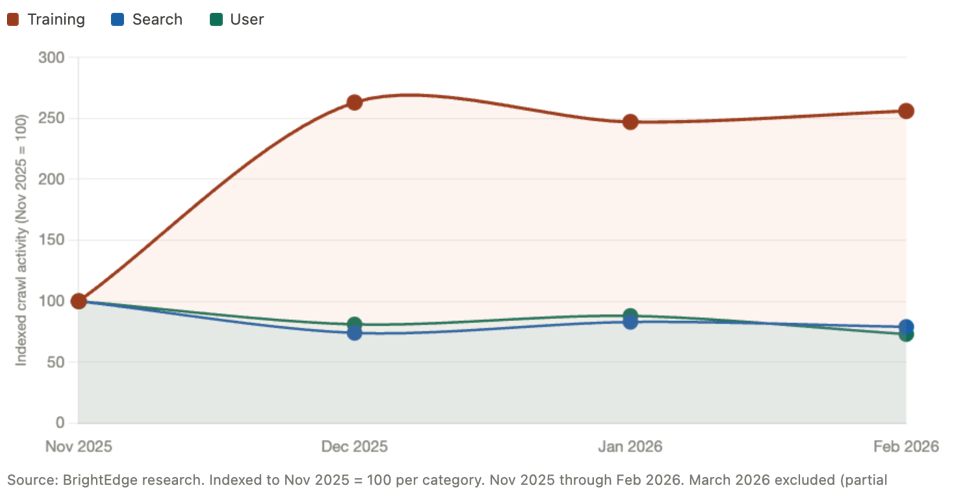
Googlebot crawls with a relatively predictable schedule tied to PageRank and crawl budget. AI agents crawl far less predictably. They respond to user demand: when a topic spikes in AI chat activity, the relevant agents often re-crawl the web to update their knowledge. According to BrightEdge research, AI training crawl activity grew by more than 160% in a single month in late 2025, driven by large-scale re-indexing events. This kind of volatility has no equivalent in traditional SEO.
What AI agents do share with traditional crawlers is a reliance on robots.txt and XML sitemaps. Despite all the discussion around llms.txt as an emerging standard for AI-specific directives, most AI agents currently do not request it. What they do request is robots.txt, which means your existing access rules are already governing whether these agents can reach your content. They also pull sitemaps, making an up-to-date sitemap one of the simplest and most overlooked levers for AI crawl coverage. If your sitemap is stale or incomplete, you are leaving pages off the table before an agent ever decides whether to cite them.
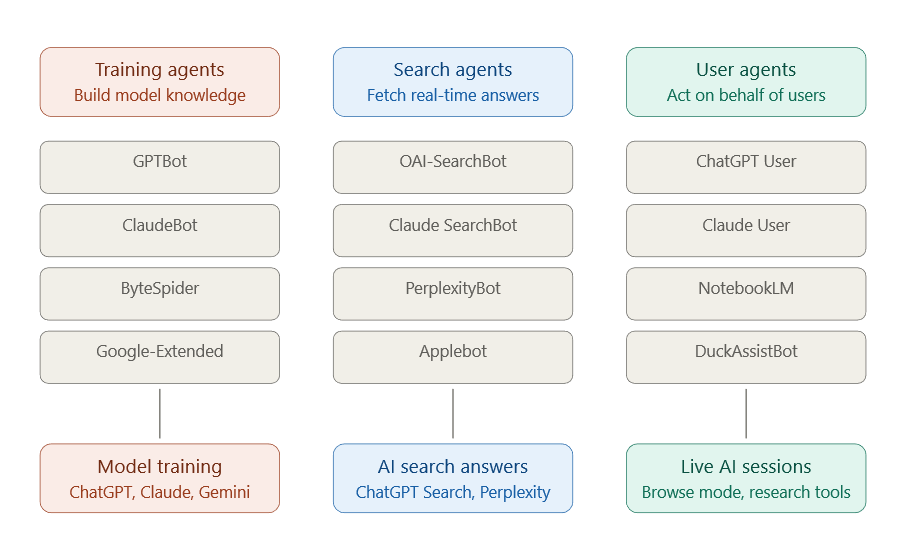
Three Types of AI Agents
Not all AI agents serve the same function. BrightEdge research identifies three distinct categories of AI agent crawl activity, each with different implications for search marketers.
- Training agents build and refresh the knowledge base that powers AI models. They crawl broadly and at high volume. Their activity does not directly drive citations, but the content they consume shapes what the model knows and, over time, what it surfaces in answers. According to BrightEdge research, training crawls account for the largest single share of AI agent activity on enterprise sites.
- Search agents retrieve content to power AI search answers and citations. When someone asks Perplexity a question or uses ChatGPT Search, these agents go out and fetch current information. They are citation-driven by design, and optimizing for them has the most direct impact on AI search visibility.
- User agents act on behalf of an individual user during an active session — powering browse mode in ChatGPT, research features in Claude, or AI-assisted tools like Google NotebookLM. They crawl fewer pages per session but often with high intent, following links in ways that reflect a real research workflow.
Which AI Agents Are Crawling Your Site?
The AI agent ecosystem has expanded faster than most marketing teams have tracked it. What started as a handful of well-known bots has grown into a multi-platform landscape spanning major technology companies, independent AI search engines, and emerging players whose crawl volume is rising quickly.
The table below covers the agents BrightEdge research tracks across sites, including their user-agent strings (the identifiers you will find in your server logs and robots.txt configurations), the products they feed, and their relative share of AI crawl activity.
| Agent Name | User-Agent String | Type | Powers | BrightEdge Data |
|---|---|---|---|---|
| GPTBot | openai_gptbot | Training | ChatGPT, Responses API | 51% of training crawls |
| OAI-SearchBot | OAI-SearchBot | Search | ChatGPT Search | 49% of AI search crawls |
| ChatGPT User | openai_chat_gpt_user | User | ChatGPT (browse mode) | 96% of AI user traffic |
| ClaudeBot | ClaudeBot | Training | Claude.ai, Claude API | 17% of training crawls |
| Claude SearchBot | Claude-SearchBot | Search | Claude (web search) | 15% of AI search crawls |
| PerplexityBot | PerplexityBot/1.0 | Search | Perplexity AI answers | 6% of AI search crawls |
| AppleBot | Applebot | Search | Apple Intelligence, Siri | 29% of AI search crawls |
| ByteSpider | Bytespider | Training | TikTok, ByteDance AI | Up 138% Nov–Feb 2026 |
| Google-Extended | Google-Extended | Training | Gemini, AI Overviews | Separate from Googlebot |
| NotebookLM Bot | Google-NotebookLM | User | Google NotebookLM | Up 144% Nov–Feb 2026 |
| DuckAssistBot | DuckAssistBot | User | DuckDuckGo AI Chat | Consistent activity |
| MetaExternalAgent | Meta-ExternalAgent | Training | Meta AI | Low volume, emerging |
Source: BrightEdge AI Agent Insights research, November 2025 through February 2026.
What the Data Tells Us
OpenAI Has the Largest Footprint — Across All Three Categories
According to BrightEdge research, OpenAI agents account for the majority of AI agent crawl activity across enterprise sites when training, search, and user categories are measured together. GPTBot (the training crawler) represents more than half of all AI training crawl volume. OAI-SearchBot drives nearly half of all AI search crawl activity. And ChatGPT's user-facing agent accounts for more than 96% of all AI user bot traffic. No other platform comes close to that concentration across all three functions simultaneously.
For search marketers, this means that if your site has any friction with OpenAI agents — whether through robots.txt blocking, server configuration issues, or JavaScript rendering barriers — the downstream impact on ChatGPT Search visibility is significant.
Apple Is a Bigger Player Than Most Teams Realize
Applebot accounts for nearly 30% of AI search crawl activity in BrightEdge research, making it the second-largest AI search crawler by volume. Apple Intelligence, Siri's enhanced web features, and Safari's AI summaries all run through this agent. Because Apple does not have a traditional search engine interface, many teams overlook its role in AI-driven content distribution. That is a blind spot worth correcting.
ByteSpider Is Growing Fast
Bytespider, the crawler powering TikTok's parent company ByteDance and its AI products, grew its crawl volume by 138% between November 2025 and February 2026 in BrightEdge research. It now represents nearly a third of all AI training crawl activity. Most marketing teams are not tracking it at all. As TikTok's AI search and answer features expand, ByteSpider's role in determining content eligibility will grow with them.
ClaudeBot Spiked Dramatically in Late 2025
Anthropic's training crawler (ClaudeBot) saw an increase of more than 800% between November and December 2025, followed by continued elevated activity through early 2026. This kind of spike typically reflects a large-scale model training or knowledge refresh event. It is a reminder that AI training crawl activity does not follow a linear schedule — it surges in response to platform decisions that happen entirely outside your control. Visibility into that activity requires real-time monitoring, not after-the-fact log analysis.
Google NotebookLM Is an Emerging Signal
Google NotebookLM's crawl agent grew by 144% between November 2025 and February 2026 in BrightEdge research. While its total volume remains smaller than the major search and training crawlers, its trajectory reflects the broader expansion of AI user tools that fetch live web content on behalf of researchers, analysts, and knowledge workers. Content that is accessible and well-structured has a direct advantage as this category scales.
A Note on Agent Identification
User-agent strings are declared by the crawler but are not cryptographically verified. Most major agents follow declared conventions, but you should validate agent identity through their documented IP ranges when it matters. OpenAI, Anthropic, Google, and Perplexity all publish their IP ranges and crawler documentation. Cross-referencing user-agent strings with source IP ranges is the reliable method for confirming agent identity in your server logs.
Are You Blocking the Agents That Matter?
A meaningful share of enterprise sites are inadvertently blocking one or more major AI agents. They are not doing it on purpose. They are doing it through legacy robots.txt configurations, blanket AI-blocking rules added reactively in 2023 and 2024, or misconfigured server settings that treat AI agents the same way they treat scrapers. The result is the same regardless of intent: invisible to AI search, ineligible for citation, absent from AI-generated answers.
According to BrightEdge research, server errors accounted for nearly a quarter of all ChatGPT user agent requests in January 2026 across a broad set of enterprise sites. That suggests configuration problems rather than isolated incidents.
Understanding robots.txt for AI Agents
The robots.txt file remains the primary mechanism for controlling how non-human entities access your site. The challenge is that most robots.txt files were written for a world with two or three major crawlers, not the dozen or more AI agents now active on the web. Rules that made sense in 2020 may be creating unintended blocks today.
The Wildcard Problem
The most common configuration issue is a wildcard Disallow rule used to block the generic "everyone else" catch-all, combined with explicit Allow rules for Googlebot and a few other crawlers. In theory, this lets the crawlers you want in while blocking the ones you do not. In practice, if you have not explicitly listed every major AI agent, the wildcard catches them all.
# Common configuration that inadvertently blocks all AI agents
User-agent: Googlebot
Allow: /

User-agent: Bingbot
Allow: /

User-agent: *
Disallow: /

# GPTBot, OAI-SearchBot, ClaudeBot, Applebot, PerplexityBot
# and every other AI agent falls through to the wildcard Disallow
If your robots.txt looks similar to the example above, every AI agent not explicitly named is blocked. That includes ChatGPT Search, Claude, Perplexity, and Apple Intelligence.
The Reactive Block Problem
In 2023 and 2024, many brands added explicit blocks for AI training crawlers in response to legitimate concerns about content scraping and unauthorized use of proprietary material. The problem is that many teams blocked agents using identifiers that also cover the search and user-facing versions of those same products. Blocking GPTBot blocks OpenAI training crawls. Blocking OAI-SearchBot blocks ChatGPT Search. They are different agents with different functions, governed by different user-agent strings, and the distinction matters more than most teams realize.
This is critical because those agents power the AI search that connects customers to products and services they need. This includes users that research software vendors, compare service providers, evaluate products before purchase, and identify partners for enterprise deals. These are purchase-intent moments that used to drive a user directly to your site from organic search. If your content is blocked from the agents powering those interactions, you risk not being in that conversation — and a competitor whose content is accessible will be.
The Recommended Configuration
Most enterprise sites should keep AI agents open by default. Restricting access is likely costing you visibility.
# Recommended baseline for AI agent access

# OpenAI: allow search and user agents, manage training separately
User-agent: OAI-SearchBot
Allow: /

User-agent: openai_chat_gpt_user
Allow: /

User-agent: GPTBot
Allow: / # Change to Disallow: / if you want to opt out of training

# Anthropic
User-agent: ClaudeBot
Allow: /

User-agent: Claude-SearchBot
Allow: /

# Apple
User-agent: Applebot
Allow: /

# Perplexity
User-agent: PerplexityBot
Allow: /

# Google AI (separate from Googlebot)
User-agent: Google-Extended
Allow: / # Change to Disallow: / to opt out of Gemini/AI Overviews training
Beyond robots.txt: Other Access Barriers
Server-Level Blocks
Some hosting configurations, WAF (Web Application Firewall) rules, and bot management platforms treat AI agents the same as malicious scrapers. If your site has Cloudflare, Akamai, Imperva, or a similar bot management layer, check whether AI agents are being challenged or blocked at the network level. A 200-status response in your robots.txt is irrelevant if the agent is getting a 403 or a CAPTCHA challenge before it reaches your content.
The January 2026 server error spike in BrightEdge research — where nearly one in four ChatGPT user agent requests returned a server error — is consistent with WAF or rate-limiting rules that tightened during a period of elevated AI crawl activity. Sites that addressed this proactively maintained their citation visibility. Sites that did not saw gaps.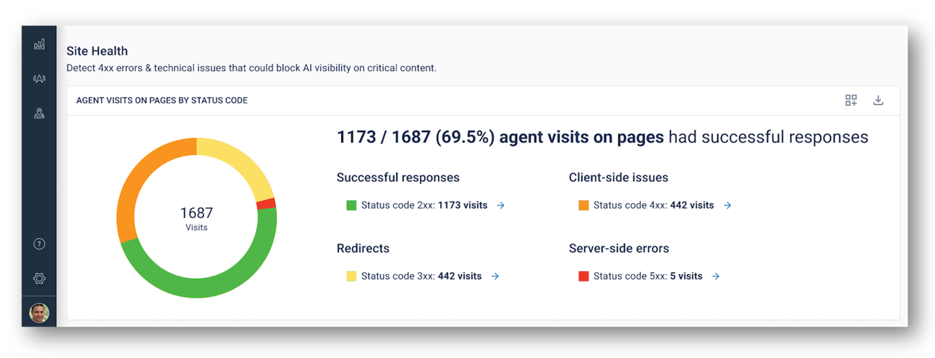
Brightedge AI Agent Insights showing only 70% of agent visits having successful responses, with 5 specifically encountering server side errors
JavaScript Rendering
Most AI agents do not execute JavaScript. This means content loaded client-side — product descriptions, article bodies, navigation, or metadata — may simply not exist from an AI agent's perspective. If your site uses React, Next.js, Angular, or a similar framework without server-side rendering or static generation, run a crawl simulation using a non-JavaScript crawler and compare what it sees to what a browser renders. The gaps are where AI agents are going blind.
Crawl Rate and Response Speed
AI agents do not always send a Crawl-Delay directive or respect one if present. Sites with aggressive rate limiting may be returning errors to AI agents that are crawling at a pace the server interprets as suspicious. Review your rate-limiting thresholds and confirm that known AI agent IP ranges are not being throttled or blocked by your infrastructure. Each major AI platform publishes its crawler IP ranges; adding them to an allowlist in your WAF or CDN is a straightforward step.
How to Audit Your Current AI Agent Access
If you are not sure whether your site has AI agent access issues, here is a practical audit process to run today.
- Check your robots.txt. Fetch yourdomain.com/robots.txt and look for any Disallow: / rules, wildcard configurations, or explicit blocks for AI agent user-agent strings. Flag anything that could be catching agents you want to allow.
- Audit crawl activity. Pull the last 30 days of AI agent activity and review which agents are reaching your site, their request volume by category, and their error rates by agent type. A healthy AI agent interaction should show 200-status responses at 90% or better.
- Check your WAF and CDN rules. Review bot management configurations for any rules that apply to AI agent user-agent strings or IP ranges. Confirm that known AI crawler IP ranges are not on block or challenge lists.
- Validate your sitemap coverage. AI search agents use sitemaps as a starting point. Confirm your XML sitemap is current, correctly submitted, and includes the pages you most want cited. Exclude pages you do not want agents to reach.
llms.txt Is an Emerging Format but Slow to Adopt
llms.txt is an emerging specification that lets site owners create a curated index of their most important content for AI agents. The idea is sound: rather than forcing an agent to crawl and parse HTML, you give it a clean, structured entry point to your most important pages.
Adoption among publishers has grown quickly as Anthropic, Cloudflare, Stripe, Perplexity, and others have all published them. The catch is that there is currently no evidence the major AI agents are systematically requesting llms.txt files. Publishing one is low effort and worth doing as a forward-looking measure, but it won't move any needle for you today.
Monitor this space. If agent behavior shifts and retrieval patterns start showing llms.txt requests at scale, the implementation lift is minimal and you will want to be ready.
What llms.txt Is and What It Is Not
According to the official specification maintained at llmstxt.org, the file is designed primarily for use at inference time: when a user is actively asking an AI tool for help and the agent is fetching context to answer well. It is a table of contents, not a content delivery mechanism. The linked pages still need to serve accessible, well-structured content for the agent to actually read.
The llms.txt File Format
The file lives at the root of your domain at yourdomain.com/llms.txt. It uses a specific markdown structure defined by the spec:
- H1 header: The name of your site or project. This is the only required element.
- Blockquote: A short summary of the site or project. One to two sentences capturing what the site is and who it serves.
- Optional body text: Additional context about the site, its content, or how to interpret the files below. No heading elements here.
- H2 sections with file lists: Named sections, each containing a markdown list of links with optional descriptions. These point to the most important pages on your site.
- Optional section: A special H2 section labeled "Optional" that signals to agents they can skip those links if context window space is limited. Use it for secondary content.
# Your Company Name
> Brief summary of what your company does and who it serves.

Additional context about this site and how to interpret the content below.

## Products
- [Product Name](https://yoursite.com/products/name.md): What this product does and who it is for
- [Product Documentation](https://yoursite.com/docs/product.md): Full technical documentation

## Resources
- [Research Reports](https://yoursite.com/research/index.md): Original data and industry research
- [Case Studies](https://yoursite.com/case-studies.md): Client outcomes and implementation examples

## Optional
- [About Us](https://yoursite.com/about.md): Company background and leadership
- [Blog](https://yoursite.com/blog/index.md): Ongoing thought leadership content
A companion file, llms-full.txt, embeds the full content of all linked pages directly into a single file rather than requiring an agent to follow each link. This is particularly useful for developer tools, AI coding assistants, and agents that need comprehensive context in a single request.
Serving AI-Friendly Markdown Alongside HTML
The llms.txt spec also proposes that individual pages serve a clean markdown version at the same URL with .md appended. So yoursite.com/about would also be accessible at yoursite.com/about.md. This gives agents a direct path to clean, token-efficient content without having to parse navigation menus, footers, CSS classes, and JavaScript that carry no semantic value for an AI reader.
The efficiency difference matters. Cloudflare, which has built native markdown serving support into its platform, notes that a simple heading in markdown costs roughly three tokens, while its HTML equivalent with class attributes, div wrappers, and script tags can cost four to five times as many. Across a full page, that gap compounds significantly. Agents with limited context windows make coverage tradeoffs, and pages that waste tokens on structural HTML get less of their actual content read.
Cloudflare's "Markdown for Agents" feature implements this through HTTP content negotiation: when an agent sends an Accept: text/markdown header, the server returns clean markdown. Browsers receive normal HTML from the same URL. This is not cloaking — it is serving the same content in different formats to different consumers, which is a standard web practice.
Content Formatting for AI Agents
Once you have confirmed that AI agents can reach your content, the next question is whether that content is formatted in a way agents can efficiently read, understand, and cite.
HTML and AI Agents
Standard HTML pages carry a significant amount of structural content that is essential for browser rendering but carries no semantic value for an AI agent. Navigation menus, footer links, CSS class names, JavaScript function calls, schema markup wrapper tags, and advertising containers all consume tokens without contributing to the meaning of your content. An agent reading a typical enterprise webpage spends a large portion of its context window on markup that tells it nothing about what you know or what you offer.
The practical result is that agents get less of your actual content per request. Pages that efficiently deliver their meaning in clean, structured text have an advantage in how thoroughly they get read and processed — which is the precondition for citation.
Writing for AI Agent Comprehension
The formatting practices that make content clear to AI agents align closely with what makes content clear to human readers. That is not a coincidence. Agents learn from human-written text and respond to the same clarity signals humans do. The following principles are drawn from how AI agents are known to process and evaluate text.
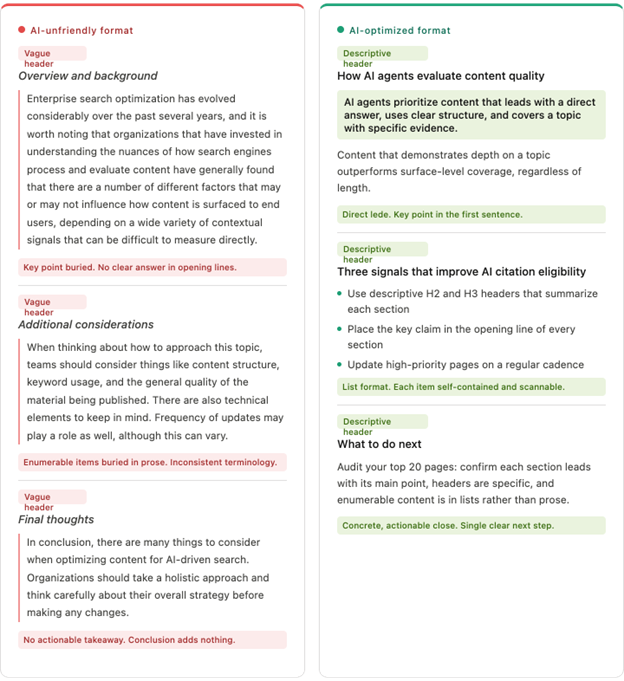
Lead With the Answer
AI agents, like human researchers, are often looking for a direct answer to a specific question. Content that buries the key claim or conclusion three paragraphs in makes the agent work harder to extract it — and risks the most important information being truncated when context windows fill up. Put the primary point in the first sentence of each section, then support it.
Use Headers to Signal Structure
Markdown H1, H2, and H3 headers are strong semantic signals. An agent reading your content uses headers to build a structural map of the page before processing the body text. Clear, descriptive headers that accurately summarize the section that follows help agents navigate and excerpt content appropriately. Vague headers ("More Information," "Overview," "Details") reduce that navigational value.
Write in Discrete, Self-Contained Units
Agents often read and cite individual passages rather than full pages. A paragraph or section that can stand alone, without requiring the reader to have read the previous three paragraphs for context, is easier to cite accurately. This does not mean writing in fragments — it means that each section should be coherent on its own as well as part of the whole.
Use Lists for Enumerable Content
When content consists of discrete items — steps in a process, features of a product, categories in a taxonomy — bullet or numbered lists communicate that structure more clearly than prose. An agent reading a list knows it is looking at a collection of parallel items. The same information in paragraph form requires the agent to infer that structure, which introduces parsing overhead and potential for misrepresentation.
Be Consistent With Terminology
Agents build an understanding of your domain vocabulary from the text they read. If your site refers to the same concept by three different names across different pages — using "customer," "client," and "user" interchangeably, for example — agents may treat them as distinct concepts or fail to connect related information. Standardizing terminology across your content library is a low-effort, high-impact practice for AI comprehension.
Avoid Jargon Without Definition
Industry shorthand that your human audience recognizes instantly may mean nothing to an agent operating outside your specific context. If you use acronyms or proprietary terminology, define them on first use and use them consistently thereafter. This applies equally to product names, internal frameworks, and category labels.
Schema Markup and Structured Data
JSON-LD structured data remains relevant for AI agents, though its role differs from its function in traditional SEO. Search engines use schema markup primarily for rich result eligibility. AI agents use it to confirm entity identity: who wrote this, what type of content it is, when it was published, what organization produced it, and how it relates to other entities on the web.
The most impactful schema types for AI agent comprehension are:
- Article / NewsArticle / BlogPosting: Confirms content type, authorship, and publication date. Date signals matter — agents that prefer fresh content can use dateModified to assess recency.
- Organization: Establishes your entity identity, official name, website, and related properties. This is the schema that helps agents correctly attribute content to your brand across different pages and platforms.
- Person: Author credentialing. Agents increasingly weight the demonstrated expertise of the person behind content. Linking author markup to a consistent entity across your site strengthens that signal.
- FAQPage and HowTo: These types present content in a format that maps directly to how AI search agents construct answers. Well-marked FAQ and HowTo content is structurally pre-formatted for citation.
- Product: For ecommerce and product pages, structured product data including name, description, price, and reviews helps agents present accurate product information in AI shopping answers.
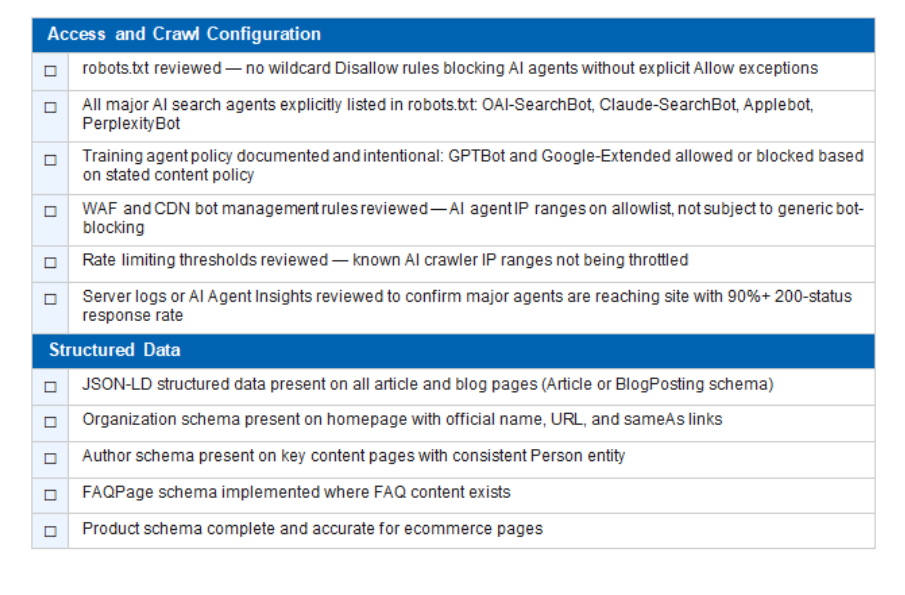
AI Agent Optimization Checklist
Access and Crawl Configuration
- robots.txt reviewed — no wildcard Disallow rules blocking AI agents without explicit Allow exceptions
- All major AI search agents explicitly listed in robots.txt: OAI-SearchBot, Claude-SearchBot, Applebot, PerplexityBot
- Training agent policy documented and intentional: GPTBot and Google-Extended allowed or blocked based on stated content policy
- WAF and CDN bot management rules reviewed — AI agent IP ranges on allowlist, not subject to generic bot-blocking
- Rate limiting thresholds reviewed — known AI crawler IP ranges not being throttled
- Server logs or AI Agent Insights reviewed to confirm major agents are reaching site with 90%+ 200-status response rate
Structured Data
- JSON-LD structured data present on all article and blog pages (Article or BlogPosting schema)
- Organization schema present on homepage with official name, URL, and sameAs links
- Author schema present on key content pages with consistent Person entity
- FAQPage schema implemented where FAQ content exists
- Product schema complete and accurate for ecommerce pages
Frequently Asked Questions
What is an AI agent in the context of SEO?
An AI agent is an automated system that crawls the web, retrieves and processes content, and uses what it finds to power an AI product: a chatbot, a search answer engine, a research tool, or a training dataset. Unlike a traditional web crawler focused on indexing pages for ranking, AI agents are evaluating content for use in answers, citations, and model training.
How is an AI agent different from a chatbot?
A chatbot is the user-facing product. An AI agent is the system that goes out and gets information to power that product. When you ask ChatGPT a question with web search enabled, ChatGPT is the chatbot — OAI-SearchBot is the agent that goes and retrieves current web content to inform the answer. The terms are often used interchangeably, but for SEO purposes the distinction matters: the agent is what is crawling your site.
Does robots.txt work for AI agents?
Most major AI agents follow robots.txt conventions. OpenAI, Anthropic, Google, Perplexity, and Apple have all documented their crawlers and stated they respect robots.txt. However, compliance is voluntary. You cannot force any agent to adhere to robots.txt, though you can verify agent behavior through server logs and follow up with the platform if violations occur.
Should I block AI agents to protect my content?
This depends on your goals and the specific agent. Blocking AI training crawlers (GPTBot, Google-Extended, ClaudeBot) prevents your content from being used in model training and is a legitimate choice. Blocking AI search and user agents (OAI-SearchBot, Claude-SearchBot, Applebot, PerplexityBot) removes your content from eligibility for AI search citations and AI-generated answers, which is increasingly a significant traffic and visibility channel. Most brands benefit from a differentiated policy: block or restrict training agents based on content policy, while permitting search and user agents.
What is GPTBot and should I allow it?
GPTBot is OpenAI's training crawler. It crawls the web to collect content for model training. Allowing GPTBot means your content may be used to train future OpenAI models. Blocking it means it will not be, but it does not affect whether ChatGPT Search (powered by OAI-SearchBot) can cite you in live answers. These are separate agents with separate robots.txt user-agent strings. Check yourdomain.com/robots.txt and confirm you have an explicit policy for both.
What is the difference between GPTBot and OAI-SearchBot?
GPTBot is OpenAI's training crawler — it builds the underlying knowledge of the model. OAI-SearchBot is OpenAI's real-time search crawler — it retrieves current web content to answer live user queries in ChatGPT Search. Blocking GPTBot affects training data. Blocking OAI-SearchBot affects live search citation. Most visibility-focused brands want to allow OAI-SearchBot even if they restrict GPTBot.
What is llms.txt and do I need one?
llms.txt is a markdown file proposed in September 2024. It lives at yourdomain.com/llms.txt and provides AI agents with a curated map of your most important content. It is most useful for sites with developer documentation, APIs, or structured product information. For content-first marketing sites, it is worth implementing as a good-practice signal, but access and content quality are higher priorities.
Why is my AI agent traffic not showing up in Google Analytics?
Most AI agents do not execute JavaScript, which means they do not trigger GA4 or any other client-side analytics. Server logs capture agent activity because they record all HTTP requests regardless of JavaScript execution. AI referral traffic from users who click through from AI answers does appear in analytics — look for referral sessions from domains like perplexity.ai, chatgpt.com, and similar AI platform domains.
How do I know if AI agents are encountering errors on my site?
Check your server logs for 4xx and 5xx status codes associated with AI agent user-agent strings. A healthy AI agent interaction should show 200-status responses on 90% or more of requests.
Does having a faster website help with AI agent crawling?
Yes, particularly for search-type agents that are operating under time constraints when fetching content for live user queries. Slow server response times can result in timeouts or partial content retrieval.
How do I get my content cited in AI answers?
The observable factors that correlate with stronger citation performance are: clean agent access, well-structured content, consistent entity signals, depth of expertise on your core topics, and regular content updates.
How is AI search different from traditional SEO?
Traditional SEO optimizes for ranking positions in a list of results. AI search optimization aims for citation presence in AI-generated answers that may not include a traditional ranked list at all. Some signals overlap — such as authority, quality, and relevance — but the specific content formatting, technical requirements, and measurement approaches are distinct. This guide includes specific technical components that are unique to Agentic Engine Optimization (AEO).