Black Friday 2024 vs. 2025: What a Year of Testing Taught Google About AI Overviews
Using BrightEdge AI Catalyst, we analyzed thousands of keywords heading into Black Friday/Cyber Monday — comparing November 2024 vs. November 2025. After a year of testing, Google now shows clear patterns on where AI Overviews fit in the shopping journey.
Data Collected: Analyzed AI Overview presence patterns year-over-year to understand:
- Overall AI Overview expansion by industry
- Intent-based presence patterns in eCommerce
- Search volume correlation with AI Overview appearance
- Category-level shifts in AI treatment
- Google's strategic decisions on research vs. purchase queries
Key Finding: Google expanded AI Overview presence from 34% to 46% overall (+12pp), but eCommerce sits at just 16% while all other industries average 58%. Within shopping queries, intent determines everything: "best [product]" queries exploded from 5% to 83% AI presence, while transactional and pure product queries remained flat at 13-14%. Google learned that AI helps shoppers research but gets in the way when they're ready to buy.
The Year-Over-Year Shift
The Headline Numbers
November 2024: 34% of all keywords had AI Overviews
November 2025: 46% of all keywords have AI Overviews
But that +12pp growth is not evenly distributed. Google got highly selective.
The Industry Divide
eCommerce: 16% AI Overview presence
All Other Industries: 58% AI Overview presence
Google expanded AI aggressively everywhere — except shopping. That's not an accident.
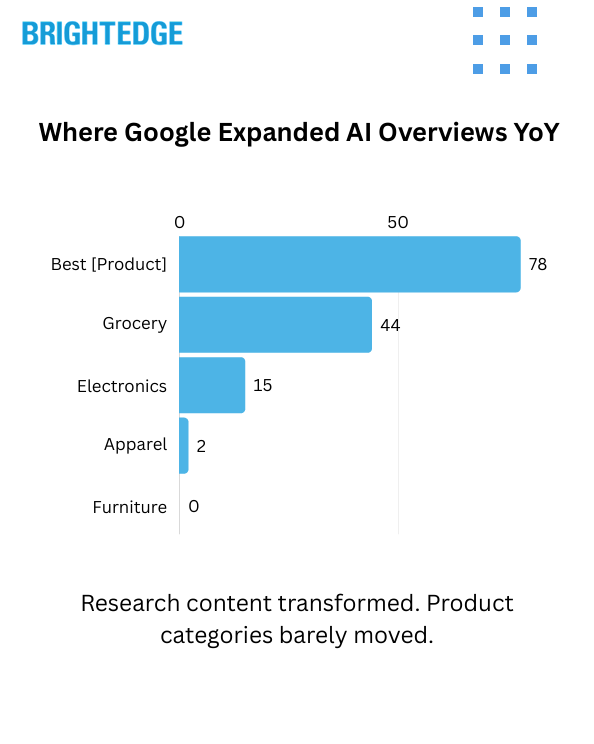
Where Google Expanded AI Overviews YoY
The Biggest Gainers
The categories and query types that saw dramatic AI Overview expansion:
- "Best [product]" queries: 5% → 83% (+78pp)
- Grocery/Food: 5% → 49% (+44pp)
- Entertainment: 4% → 47% (+43pp)
- Travel: 32% → 57% (+25pp)
- Electronics: 9% → 24% (+15pp)
- TV & Home Theater: 13% → 25% (+12pp)
- Small Kitchen Appliances: 13% → 24% (+10pp)
Google leaned heavily into research and consideration content.
Where Google Held Back
Meanwhile, transactional shopping categories barely moved:
- Apparel: 8% → 11% (+2pp)
- Home: 10% → 9% (-1pp)
- Furniture: 2% → 2% (flat)
- Pure product queries: Still under 15%
High-volume purchase terms like "65 inch tv" or "mens sneakers" remain AI Overview-free zones.
The Intent Line Google Drew
Query Intent Determines AI Presence
Forget categories. The real pattern within eCommerce is intent:
- Informational Queries ("best air fryer"): 83% have AI Overviews
- Transactional Queries ("buy air fryer"): 13% have AI Overviews
- Pure Product Names ("air fryer"): 14% have AI Overviews
The "Best" Query Explosion
The single biggest YoY shift in our entire dataset:
- 2024: 5% of "best [product]" queries had AI Overviews
- 2025: 83% of "best [product]" queries have AI Overviews
That's a +78pp swing in one year. If you're ranking for "best" content, the SERP you optimized for last holiday season no longer exists.
What This Tells Us
Google spent 2024 figuring out where AI helps versus where it gets in the way. Their conclusion:
- Research Phase: AI Overviews add value
- Purchase Phase: Traditional results close the sale
The data proves it. Informational queries saw massive AI expansion. Transactional queries stayed deliberately protected.
What the Volume Data Reveals
The Unexpected Pattern
Across all industries, we found an inverse relationship between search volume and AI Overview presence:
- Under 1K volume: 45% → 60% (+15pp)
- 1K - 5K volume: 46% → 61% (+15pp)
- 5K - 10K volume: 34% → 46% (+12pp)
- 10K - 50K volume: 26% → 36% (+11pp)
- 50K - 100K volume: 21% → 32% (+12pp)
- 100K+ volume: 20% → 28% (+8pp)
Lower volume keywords consistently have higher AI Overview rates.
But eCommerce Is Different
In eCommerce specifically, AI Overview presence is flat across all volume tiers: 14-19% regardless of search volume.
Translation: Google isn't using search volume to decide which shopping queries get AI treatment. They're using intent signals. A 500K volume product query stays protected while a 5K "best" query gets an AI Overview.
Category Deep Dive: eCommerce
AI Overview Presence by Category (2025)
- Grocery: 5% → 49% (+44pp)
- Electronics: 9% → 24% (+15pp)
- TV & Home Theater: 13% → 25% (+12pp)
- Small Kitchen Appliances: 13% → 24% (+10pp)
- Apparel: 8% → 11% (+2pp)
- Home: 10% → 9% (-1pp)
- Furniture: 2% → 2% (flat)
Why Grocery Stands Out
Grocery saw the largest expansion because food queries blend informational intent with shopping. Queries like "cottage cheese," "prosciutto," or "vegetables" have educational components (nutrition, recipes, preparation) that AI Overviews can address — unlike pure product queries.
Why Furniture Stayed Flat
At just 2% AI Overview presence in both years, furniture represents a category Google has deliberately kept AI-free. High-consideration, high-price purchases appear to warrant traditional search results where users can compare retailers, prices, and options directly.
Holiday Shopping Categories: The Black Friday View
Traditional Black Friday/Cyber Monday Categories
- Computers/Laptops: 6% → 21% (+15pp)
- Small Kitchen Appliances: 13% → 24% (+10pp)
- TVs: 9% → 18% (+9pp)
- Streaming Devices: 35% → 42% (+8pp)
- Apparel: 8% → 11% (+2pp)
- Furniture: 2% → 2% (flat)
The Mattress Reversal
One notable outlier: Mattresses dropped from 44% to 17% AI Overview presence (-27pp). Google appears to have pulled back AIOs for this high-consideration category — possibly recognizing that mattress shoppers need to compare retailers and deals rather than get AI-summarized answers.
The Strategic Implications
Two Metrics for 2025
Last year, your "best [product]" pages competed for Position 1. This year, they compete for AI citations while Position 1 sits below the fold.
This means tracking two different metrics:
- For Research Queries: Are you being CITED in AI Overviews?
- For Purchase Queries: Are you RANKING in organic results?
Same content calendar. Different success metrics depending on intent.
The Dual-Channel Reality
This isn't about AI OR organic anymore. It's both:
- Your "best [product]" content needs to be citation-worthy for AI
- Your product pages need traditional SEO excellence
- Same brand, two battlefronts
What Google Learned (And What You Should Too)
Google tested aggressively in 2024. They kept what worked, pulled back what didn't.
Their conclusion: Let AI guide consideration. Let results close conversion.
The brands who adapt aren't choosing between AI optimization and traditional SEO — they're matching their strategy to Google's intent-based approach.
Strategic Implementation Framework
For Research Content ("Best [Product]" Queries)
Your Reality: 83% of these queries now show AI Overviews
Your Goal: Get cited, not just ranked
Action Items:
- Create comprehensive comparison content that AI can summarize
- Include clear, factual statements that work as citation sources
- Structure content with distinct sections AI can reference
- Update existing "best" content for citation-worthiness
For Product Pages (Transactional Queries)
Your Reality: Only 13-14% show AI Overviews
Your Goal: Win the traditional ranking game
Action Items:
- Traditional on-page SEO still dominates
- Focus on shopping feed optimization
- Product schema markup matters
- Page speed and Core Web Vitals remain critical
For Category Pages
Your Reality: Intent varies by category
Action Items:
- Grocery/Food: Prepare for high AI presence, optimize for citations
- Apparel/Furniture: Traditional SEO focus, minimal AI disruption
- Electronics: Mixed approach — research content needs citation optimization, product pages need ranking focus
Action Items for Holiday 2025
Immediate Actions
- Audit Your "Best" Content: The SERP changed dramatically. Review your top research-phase content for citation-worthiness.
- Segment by Intent: Map your pages to informational vs. transactional buckets. Apply different success metrics to each.
- Check Your Exposure: What percentage of your traffic comes from "best" queries? That's your AI Overview exposure rate.
Content Priorities
High Priority (AI Citation Focus):
- "Best [product]" guides
- Comparison content
- Buyer's guides
- "How to choose" content
Standard Priority (Traditional SEO):
- Product pages
- Category pages
- Brand pages
- Transactional landing pages
Measurement Framework
For Research Queries, Track:
- AI Overview citation presence
- Citation position within AI Overview
- Brand mention frequency
For Purchase Queries, Track:
- Organic rank position
- Click-through rate
- Shopping carousel presence
Technical Methodology
Data Source: BrightEdge AI Catalyst
Analysis Approach:
- Same keyword set pulled at identical time points (Black Friday week 2024 vs. 2025)
- AI Overview presence tracked as binary (yes/no) per keyword
- Intent classification based on query patterns and modifiers
- Volume segmentation using monthly search volume data
- Category taxonomy applied consistently across both years
Measurement Periods: November 2024, November 2025
Key Takeaways
- The 12pp Growth: Overall AI Overview presence grew from 34% to 46%, but distribution is highly uneven
- The 16% vs 58% Divide: eCommerce has dramatically lower AI presence than all other industries
- The 78pp Explosion: "Best [product]" queries saw the largest single shift in AI Overview presence
- The Intent Line: Google drew a clear boundary — AI for research, traditional results for purchase
- The Volume Insight: Search volume doesn't determine AI presence in eCommerce; intent does
The Strategic Reality: Brands need to track citations AND rankings — different metrics for different query types
Industry Implications:
This research reveals that Google has moved past experimentation. After a year of testing, they've made deliberate decisions about where AI Overviews add value in the shopping journey and where they don't.
The implications are clear: the SERP you optimized for last holiday season may no longer exist for research queries, while purchase-intent queries remain largely unchanged. Success in 2025 requires understanding this divide and building a strategy that addresses both realities.
For brands preparing for Black Friday, Cyber Monday, and the holiday season, the principle holds: optimize once, win everywhere. But now you need to measure success differently depending on where in the journey your content lives — and recognize that Google has already decided where AI belongs.
Download the Full Report
Download the full AI Search Report — Black Friday 2024 vs. 2025: What a Year of Testing Taught Google About AI Overviews
Click the button above to download the full report in PDF format.
Published on November 27, 2025