





Daltile Drives Content Marketing Success with BrightEdge

Amy Rehmeyer, Director of Digital Marketing, leverages BrightEdge to produce video and top-of-funnel content for Daltile

Wiley Uses BrightEdge to Demonstrate the Real Revenue Returns of Search and Content

97th Floor Agency Wins with BrightEdge and Quick Answers Reporting


CPM google serp layout changes

Noble Studios Drives YoY Gains in Organic Across Client Base

The company uses the Data Cube 1000 times per day on behalf of its clients

40%
increase in organic traffic

THE PROBLEM

Noble Studios needed a consistent and efficient means to drive organic search results across its agency client base. They started using BrightEdge approximately three years ago as they started growing their search and specifically their SEO practice. They have found BrightEdge indispensable in centralizing that effort and standardizing the process and see results across the client base consistently improving. “We attribute that success a great deal to the partnership with have with BrightEdge,” said Noble Studios’ CMO Michael Thomas.

THE SOLUTION

“We follow a methodology that has included BrightEdge across every step of the process from competitive research to establishing goals. And I think what BrightEdge does better than any platform that we’ve used to date is the ability to customize reporting and customize results. BrightEdge ran some results for us and indicated that our company uses the Data Cube about 1,000 times per day on behalf of the clients that we represent. It’s a great stat. It shows that it’s become engrained in our culture.” “The BrightEdge platform is constantly innovating. I think listening to customers about what tools they need allows you to do that. And it’s very clear that BrightEdge listens to their customers and anticipates where they’re going, not just providing what they’re asking for.” See Michael's video.

michael thomas noble studiosTHE RESULTS

“BrightEdge is the reason that Noble Studios is having a great success for our clients in organic search. We saw that across the board our clients had a 40% year-over-year increase in organic traffic on the BrightEdge platform. They love those results."

And ultimately it is about performance. The C-suite is incredibly busy and so if you can’t succinctly tell your story it’s probably not going to be heard.

Request a demo of the BrightEdge platform today!

Wellbiz Brands Masters Local Search for Hundreds of Local Locations

Danielle Yuthas helped many locations achieve highly visible Local 3-Pack results for key terms

THE PROBLEM

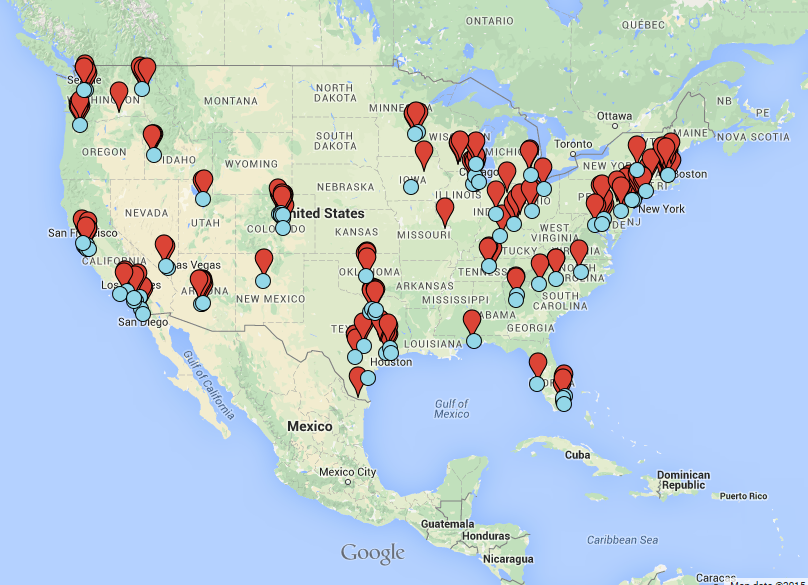
WellBiz Brands manages three separate franchise entities: Fitness Together, Elements Therapeutic Massage, and Fit 36, with a total of over 400 locations in 36 states. The parent company looks to provide marketing and guidance to support the growth and revenue of its franchisees.wellbiz national locations map

Yuthas’ challenge was to customize reporting and search engine optimization recommendations to each location or website within a brand in unique markets. She wanted each franchise owner to receive custom reports highlighting SEO successes and opportunities at a brand level as well as an individual studio level. She also wanted to give them the ability to improve the SEO on studio microsites and track results.

THE SOLUTION

Yuthas took the following approach:

  1. Create a dashboard for each location
  2. Create a location-filtered Data Cube report for each location
  3. Map each location to the local Google search engine in BrightEdge
  4. Create local Share of Voice reports for each location
  5. Add keyword tracking progress reports for each location
  6. Train and enable each franchise representative to use the reports

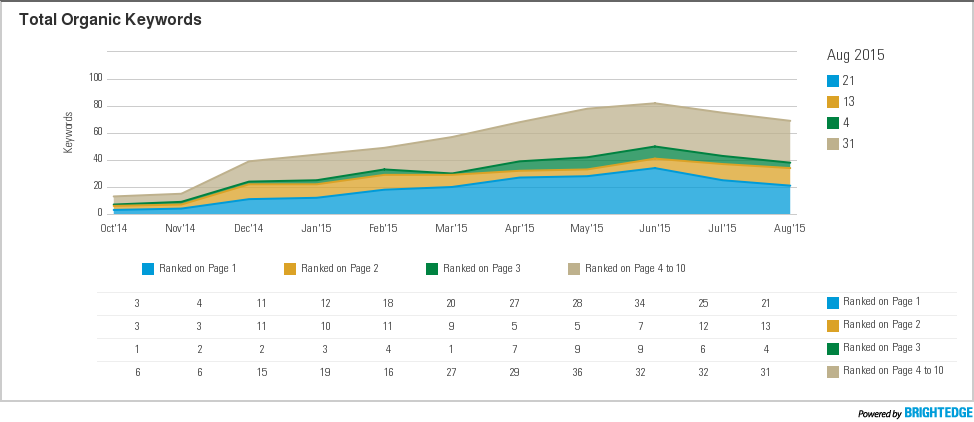
WellBiz BrightEdge total organic keywords report

Danielle Yuthas, WellBiz BrandsTHE RESULTS

Individual franchises saw dramatic improvement on targeted keywords and started appearing in the first page of the search results. Many locations achieved highly visible Local 3-Pack results for key terms, increased site traffic, store traffic, and revenue.

Educating the franchisees on SEO was a huge challenge. I made training videos on how to use the reports. BrightEdge shows the business value of impacting the Google search results.


Request a demo of the BrightEdge platform today!

Data Visualization

Best Practices for Data-Driven Problem Solving

Data Visualization

This whitepaper outlines the nine steps to conceiveing, creating, and delivering dashboards for maximum impact, including:

  • Which chart type gives the fastest, clearest answer
  • How to best use colors for meaning
  • How to distribute dashboards
  • How to drill down and do custom reporting

Meaningful dashboards and charts start with meaningful questions. By casting goals as robustly-defined problems, dashboards can show solution implementation and outcomes over time. Results can be scalable and repeatable, without the scramble to meet the goal du jour.

Download the full whitepaper for the best problem solving tips you'll need.


Project Management Success with Salesforce

Manage projects and communicate at scale to achieve desired outcomes

In large organizations, how do you efficiently manage projects and effectively communicate at scale to achieve desired outcomes? How are large goals accomplished when there are several stakeholders and owners with different areas of responsibility?

These two questions are familiar ones that face many brands. While there are a variety of disparate project management tools one may use to address this challenge (including meetings, email, Microsoft Project, scheduled reports, and self-service reporting) the most effective management productivity tools incorporate the best aspects of each. 

This whitepaper discusses the challenges facing marketers and program managers tasked with the responsibility of driving and reporting on outcomes cross-functionally within an organization. Using a hypothetical customer event, a solution to those challenges is discussed, planned and executed, illustrating how a marketing initiative may be managed from beginning to end with the use of Salesforce dashboards.

Learn to leverage Salesforce dashboards beginning with this whitepaper guide.

Automated Reporting for all Stakeholders

Matt Saunders
Matt Saunders
M Posted 11 years 2 months ago
t 9 min read

The BrightEdge platform can integrate with your client’s analytics suite to provide reporting that mirrors your strategy and can clearly articulate the impact of your efforts. BrightEdge makes it easy for you to report on what matters most to your clients – traffic, conversion and revenue! Talk with your agency CSM for more ideas on developing best-in-class reporting for your clients.

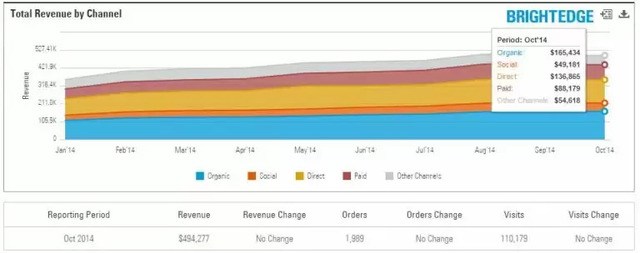
FULL DIGITAL LANDSCAPE: Compare organic visit, conversion and revenue performance against other traffic sources, including: PPC, social media & direct. Full Digital Landscape for automated reporting - brightedge

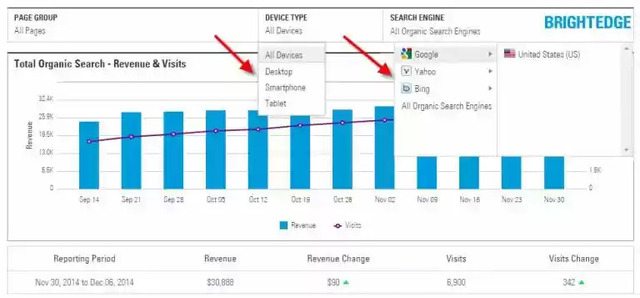
OVERALL SEO PERFORMANCE: View organic performance trends for traffic and revenue performance over time, easily toggle between:

  • Dates Ranges – view in weekly, monthly or quarterly cadence
  • Device Type – see performance for desktop, smartphone and tablet
  • Search Engine – highlight performance in Google, Bing & Yahoo individually

Overall SEO Performance for automated reporting - brightedge SEO PERFORMANCE BY SEGMENT: Generate reports that visually display data to mirror your SEO strategy. Setting up Page Groups is an important step to enable this capability. Some common ways to setup Page Groups include:
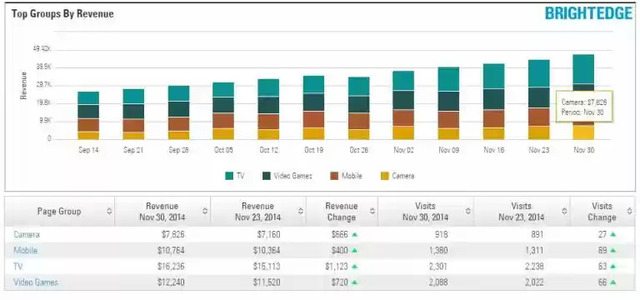
  • Align with keyword groups
  • Site section or hierarchy
  • Line of business groups

SEO Performance by Segment SEO PERFORMANCE BY PAGE: Get a granular look at the performance of individual pages being targeted for optimization and easily highlight improvements over time


Click Curve Data and SEO Success

<p>Google has made secure search the universal default, meaning&nbsp;site analytics no longer provide user search query data to correlate keywords with site visits, revenue, and conversions. As a result, marketers need to shift to a content-centric approach and manage page performance. While taking a content-centric approach is the path forward, we realize many brands have invested heavily in a keyword-centric strategy. As a transition to content-centric marketing, brands can leverage Estimated Keyword Reporting, a “triangulation" method, whereby a brand can take into account a keyword's search volume, rank, and the click through rate (CTR) to estimate how much <a href="http://www.brightedge.com/glossary/increase-organic-traffic&quot; target="_blank">organic traffic</a> a keyword is driving.</p>

<p>What powers Estimated Keyword Reporting is accurate click curves, which requires insight into keyword data that is no longer available in site analytics. Fortunately, BrightEdge foresaw the market shift and months before the change to 100% secure search, performed analysis across our 8,400 brand clients and web traffic for more than 5 billion web pages, to look at how mobile, tablet, and desktop traffic drives conversions. This comprehensive research was based on exact match keywords with no change in rank or ranked page over the course of one month. This research translated into BrightEdge Customizable Click Curves providing a baseline CTR between desktop, mobile, and tablet.
</p>

<address><strong>The change to 100% secure search means it will never again be possible to create an accurate click curve and accurate estimated keyword reporting. These unique capabilities are core to the BrightEdge platform today.</strong></address>

<p><strong>So what is a customizable click curve? </strong>A click curve allows brands to apply a custom formula or custom calculation to their business that estimates the actual search traffic based on search volume and keyword ranking.</p>

<p><img alt="" height="76" src="/sites/default/files/ctr%20calculation.png" width="196" /></p>

<p><img alt="" height="301" src="/sites/default/files/click%20curve%20big.png" width="679" /></p>

<h2>Mobile &amp; Tablet Click Curve Analysis</h2>

<p>US smartphone adoption grew by 30% in 2012 and continues to increase, yet most brands are left estimating traffic and forecasting with outmoded inaccurate desktop-only click curves. With BrightEdge’s proprietary smartphone, tablet, and desktop customizable click curves, brands benefit from understanding how CTR varies across devices. BrightEdge mobile research finds that the top 3 SERP results capture 62% of clicks as compared to 44% on desktop devices.</p>

<h2>Customizable Click Curves Power Estimated Keyword Reports</h2>

<p>Search marketers that currently manage content performance with a keyword-centric strategy require continuity in their business metrics including traffic, conversions, and revenue as these metrics are necessary to understand the overall health of a program, identify high value keywords that drive revenue, and to justify future investments. BrightEdge has leveraged our best in class rank data, along with our best in class customizable click curves to create Estimated Keyword Reporting.</p>

<p><strong>Estimated Keyword Reporting -</strong> includes estimated traffic and estimated revenue reports, enabling brands to:</p>

<ul>
<li><strong>Measure traffic and revenue -</strong> understand what efforts drive revenue and focus on these opportunities, measure traffic at the keyword or keyword group level</li>
<li><strong>Comprehensive dashboard reporting -</strong> align your team with in-depth reports which illustrate the state of your program</li>
</ul>

<p><img alt="" height="560" src="/sites/default/files/estimated%20traffic%20report.png" width="692" /></p>

<p>&nbsp;</p>

<h2>Customizable Click Curves Extend Across BrightEdge S3</h2>

<ul>
<li><strong>Share of Voice –</strong> BrightEdge’s patented Share of Voice allows brands to gain a true understanding of how content performs across all device types vs your competition. Within Share of Voice users can select desktop, tablet, smartphone, or your own custom click curves for an accurate view of Share of Voice across devices.</li>
<li><strong>Dashboard Reporting</strong> <strong>–</strong> BrightEdge customizable dashboard charts provides instant visibility into an organization’s overall content health and detailed analysis of initiatives with scheduled email delivery. Leverage customizable click curves across our flexible dashboard charts.</li>
</ul>

Click Curves are a fundamental part of forecasting for SEO professionals, helping project the volumes of traffic to be expected.

quote

Customizable Reports, Analytics, Dashboards & Forecasting

With BrightEdge's platform, standardize on a single source of truth for all your SEO reporting needs, across your digital marketing team and executive staff, with fully customizable and automated dashboards. Personalize dashboards for each business unit and team member with drag and drop charts, giving everyone easy access to the most relevant data for their role, and aligning team efforts. 

With BrightEdge SEO reporting all the information you need to fine tune your content performance effort is just one click away, whether you want to see a snapshot of overall health or dive deeper into analytics for a specific keyword group, geo-location, site or campaign. Unique SEO technology powers BrightEdge's Closed Loop Analytics, gain a clearer understanding of the impact of rank changes on ROI, providing practitioners with an easy way to communicate the business value of content performance to executive staff. 

Reporting is really the key to understanding how you’re performing. 

quote

My favorite feature within BrightEdge is the flexibility to quickly add keywords, competitive sites, change dashboards - essentially the whole flexibility of the product from a day to day operation standpoint.

quote
,