8%
increase in CTR
15%
increase in referred traffic

THE PROBLEM

As content marketing becomes more important for generating organic traffic, it becomes more important to have a well-defined process for identifying themes, producing content, repurposing content and most importantly measuring the overall gains from multiple channels.

THE SOLUTION

Ali MacDonald, Content Marketing Manager at Seagate approaches content marketing like this:

  1)  Identify themes

  2)  Perform keyword research
  3)  Develop a content plan
  4)  Create content
  5)  Measure progress

For MacDonald, the content plan in step 3 includes the marketing objective, the media asset, and the key performance metric (KPI) to measure the performance.


Tracking in BrightEdge

THE RESULTS

The BrightEdge report captures the dramatic improvement in ranked keywords from 5 to over 32, a 6- fold increase. In addition, the volume and quality of traffic was high with a 15% increase on referred traffic on that topic with a 20% increase in new visitor traffic. The clickthrough rate on the calls to action increased 8% and the campaign was regarded as success by management.

BrightEdge has been huge for us, very helpful.

Request a demo of the BrightEdge platform today!

Groupon Finds Up to 60% of Direct Traffic Actually Search

Gene McKenna, Director of Search, Groupon does groundbreaking study by deindexing site temporarily

51%
of visitors come from search
75%
of IE traffic misreported

THE PROBLEM

Understanding what traffic came from what channel is easier in digital marketing than it ever was in offline marketing. Digital marketers make rational decisions on the success and failure of campaigns and what to do with the budget based on reliable information from their web analytics tools. But what if the reporting in two of the largest online channels is less reliable than everyone thought? What if 60% of direct traffic which is usually attributed to PR, social, offline, and brand, is actually traffic from search engines with the domain referrer stripped off? That would mean that search’s contribution would be undercounted.

THE SOLUTION

Gene McKenna, director of search at Groupon, set out to answer this question and was willing to take drastic action. His hypothesis was this: If referrers are 100% accurate for direct traffic, then turning off the search traffic by setting a de-indexing command for the whole site would have no impact on direct traffic.

THE RESULTSgene mckenna director search groupon

What McKenna found was that direct traffic on interior pages dipped in a highly correlated way with the search engine traffic dip. If direct and search traffic were equal, for every 10 search visitors that were lost after de-indexing, 6 direct visitors were lost also. He found that the effect was more pronounced on interior pages with longer URLs and up to 75% of some Internet Explorer browser search traffic was reported as direct. That means that surveys like BrightEdge’s Channel Performance white paper, which found 51% of visitors coming from search (excluding direct as a channel), is still understating the proportion that comes from search engines. Both research studies confirm the significant opportunity most companies have to increase the business value they derive from search traffic. The decreased reliability of query and referrer information makes having an SEO platform more important than ever.

The referrer is a weak link in SEO reporting.

Request a demo of the BrightEdge platform today!

20%
increase in overall traffic

THE PROBLEM

Seagate is the premier hard drive and storage technology leader in the world and where Ali MacDonald is in charge of content marketing. As content marketing becomes more important for generating organic traffic, it becomes more critical to have a well-defined process for identifying themes, producing content, repurposing content, mapping to the customer journey, and, most importantly, measuring the overall gains from multiple channels.

THE SOLUTION

“SEO is important for Seagate because one of the ways that we explain to people what Seagate does is through creating great content that they’re looking for. Through SEO we help our customers find that content by understanding what their behavior is, how they search for things, and making sure that it’s easy to find on the website. One of the great things about BrightEdge is the fact that they integrate our existing analytics, so we can actually tie the dashboards that we have in BrightEdge back to the real data that we’re pulling out for other sources and other verticals in our markets.”

THE RESULTS

ali macdonald content marketing seagate“We’re focused on making sure that we’re providing the right content and information to the customer and through our partners at every level of our journey - from awareness to loyalty. We’ve seen a 20% increase in our overall traffic growth, and we’re seeing consistently steady increase in new visits to the site.”

We actually switched from a competitor of BrightEdge because of their advanced capability and technologies.

Cabela's Masters Content Performance Marketing and Organic Traffic

Jesse Farley leveraged BrightEdge for analytics and performance and elevated SEO as well as his function

THE PROBLEM

Cabela’s is a national physical and online retailer of hunting, fishing, and camping gear. Jesse Farley, Cabela's online marketing strategist, wants to develop and deploy content that guides customers through their journey to purchase and the user experience they sought. With a large catalog of products, Cabela’s needs to prioritize where to put the content marketing focus to maximize results.

THE SOLUTION

“At the end of the day it’s going to be sales, what drives the dollar. We leverage the BrightEdge platform to look at all of the steps to get to that sale from keyword placement to SERP results, to traffic, and then to sales.

The Data Cube has been phenomenal. It allows us to look at where are we in the mix, where we stack up against our competitors, and informs decisions on, frankly, getting ahead of them.

BrightEdge has been really good at providing us with the statistical data that allows us to drive the business forward. Some of our KPIs are our rankings, traffic and then, ultimately, sales.” See Jesse's Cabela's Testimonial video.

THE RESULTS

Jesse Farley, Online Marketing Strategist for Cabela's“Using BrightEdge allowed us to think outside of ourselves. We want to be able to create unique experiences for our customers that make them feel comfortable and focused in the content they’re consuming.

"BrightEdge enables us to show our executive leadership what we can do and put the metrics behind that that they didn’t necessarily think we would have. So, they hear content marketing and they don’t necessarily know how to monetize that and BrightEdge has allowed us to help get that into their minds. With the BrightEdge platform we’ve been able to communicate the effectiveness of content marketing from the C-Suite up to the board of directors," says Jesse Farley.

"The BrightEdge platform has allowed me to take basically one analyst and treat them as five. It condenses it all into one area to where we can ask the same questions and give the same answers from one platform.”

BrightEdge has given me the ability to elevate not only my program but my career. I’ve been able to really demonstrate to the enterprise how powerful content marketing can be.”

Industry SERP Report

Leverage the right data to know what your travel and leisure customers want

Industry SERP Report

Provide content marketers with predictive, data-driven content guidance.

Using BrightEdge Data Cube technology, this study focuses on providing content marketers with predictive, data-driven content guidance for this year’s holiday season.

With this unique knowledge, marketers will be able to:

  • Understand and allocate content efforts to meet consumer demand
  • Understand which industry SERPs are dominated by brands and which by aggregators
  • Leverage data and insights to know exactly what your customers want

Don’t let your content fall by the wayside. Successfully tell your company’s story and better reach your target market before the year’s end.

Leverage the full report to better market to travelers this season.


CAPTCHA
Solve this simple math problem and enter the result. E.g. for 1+3, enter 4.
This question is for testing whether or not you are a human visitor and to prevent automated spam submissions.

Content Performance Marketing

In today’s world brands are dedicating an average 39 percent of their marketing budgets to content marketing and producing 27 million pieces of content every single day. Each brand’s content is fighting a battle for consumer attention, and with this explosion of content the brands need to understand the relative content quality and performance bar.

As brands have become publishers, the digital world has become the most important distribution channel. The BrightEdge Content Performance Marketing platform helps brands Target Demand, Optimize Content, and Measure Results to win on the content battleground.

Watch this video where Oracle, Adobe, Wellbiz Brands, and more discuss Content Marketing:

Wiley partners with best-of-breed solution providers, like AdobeBrightEdge, Oracle, and Salesforce 

whose toolsets ensure we perform at our best.

quote

You have to make sure your messaging is aligned across all channels, and more importantly, they’re all working together to achieve the common business goal; that’s an omni-channel strategy.

quote

I feel as though I am constantly learning something new when I sign in.

quote

I think if you’re not doing Content Performance Marketing, you’re missing the boat.

quote

Jason Stevens of Scripps on Discovering Opportunities

CPM google serp layout changes

Click Curve Data and SEO Success

<p>Google has made secure search the universal default, meaning&nbsp;site analytics no longer provide user search query data to correlate keywords with site visits, revenue, and conversions. As a result, marketers need to shift to a content-centric approach and manage page performance. While taking a content-centric approach is the path forward, we realize many brands have invested heavily in a keyword-centric strategy. As a transition to content-centric marketing, brands can leverage Estimated Keyword Reporting, a “triangulation" method, whereby a brand can take into account a keyword's search volume, rank, and the click through rate (CTR) to estimate how much <a href="http://www.brightedge.com/glossary/increase-organic-traffic&quot; target="_blank">organic traffic</a> a keyword is driving.</p>

<p>What powers Estimated Keyword Reporting is accurate click curves, which requires insight into keyword data that is no longer available in site analytics. Fortunately, BrightEdge foresaw the market shift and months before the change to 100% secure search, performed analysis across our 8,400 brand clients and web traffic for more than 5 billion web pages, to look at how mobile, tablet, and desktop traffic drives conversions. This comprehensive research was based on exact match keywords with no change in rank or ranked page over the course of one month. This research translated into BrightEdge Customizable Click Curves providing a baseline CTR between desktop, mobile, and tablet.
</p>

<address><strong>The change to 100% secure search means it will never again be possible to create an accurate click curve and accurate estimated keyword reporting. These unique capabilities are core to the BrightEdge platform today.</strong></address>

<p><strong>So what is a customizable click curve? </strong>A click curve allows brands to apply a custom formula or custom calculation to their business that estimates the actual search traffic based on search volume and keyword ranking.</p>

<p><img alt="" height="76" src="/sites/default/files/ctr%20calculation.png" width="196" /></p>

<p><img alt="" height="301" src="/sites/default/files/click%20curve%20big.png" width="679" /></p>

<h2>Mobile &amp; Tablet Click Curve Analysis</h2>

<p>US smartphone adoption grew by 30% in 2012 and continues to increase, yet most brands are left estimating traffic and forecasting with outmoded inaccurate desktop-only click curves. With BrightEdge’s proprietary smartphone, tablet, and desktop customizable click curves, brands benefit from understanding how CTR varies across devices. BrightEdge mobile research finds that the top 3 SERP results capture 62% of clicks as compared to 44% on desktop devices.</p>

<h2>Customizable Click Curves Power Estimated Keyword Reports</h2>

<p>Search marketers that currently manage content performance with a keyword-centric strategy require continuity in their business metrics including traffic, conversions, and revenue as these metrics are necessary to understand the overall health of a program, identify high value keywords that drive revenue, and to justify future investments. BrightEdge has leveraged our best in class rank data, along with our best in class customizable click curves to create Estimated Keyword Reporting.</p>

<p><strong>Estimated Keyword Reporting -</strong> includes estimated traffic and estimated revenue reports, enabling brands to:</p>

<ul>
<li><strong>Measure traffic and revenue -</strong> understand what efforts drive revenue and focus on these opportunities, measure traffic at the keyword or keyword group level</li>
<li><strong>Comprehensive dashboard reporting -</strong> align your team with in-depth reports which illustrate the state of your program</li>
</ul>

<p><img alt="" height="560" src="/sites/default/files/estimated%20traffic%20report.png" width="692" /></p>

<p>&nbsp;</p>

<h2>Customizable Click Curves Extend Across BrightEdge S3</h2>

<ul>
<li><strong>Share of Voice –</strong> BrightEdge’s patented Share of Voice allows brands to gain a true understanding of how content performs across all device types vs your competition. Within Share of Voice users can select desktop, tablet, smartphone, or your own custom click curves for an accurate view of Share of Voice across devices.</li>
<li><strong>Dashboard Reporting</strong> <strong>–</strong> BrightEdge customizable dashboard charts provides instant visibility into an organization’s overall content health and detailed analysis of initiatives with scheduled email delivery. Leverage customizable click curves across our flexible dashboard charts.</li>
</ul>

Click Curves are a fundamental part of forecasting for SEO professionals, helping project the volumes of traffic to be expected.

quote

Daily Keyword Rank Tracking | Keyword Ranking

Search marketing is like stock trading, except the market never closes. Search is 24/7 and every day means money. Search marketers need to know when their keyword ranking drops on top converting keywords and have the ability to act quickly and avoid/minimize losses, while continually driving performance. This is where daily rank tracking comes in.

As search engines update their algorithms, the search engine results pages are in a constant state of flux with keyword ranking frequently changing. In fact, Google updates their algorithm more than 500 times each year, and in 2012 made 34 separate Panda and Penguin updates. There’s plenty to keep up with as the SERPs continue to change with algorithm updates and new competitors enter the scene, in addition to seasonal variances, new product offerings, new campaigns, and site changes. Brands need to ensure they’re equipped with the rapid feedback on keyword ranking, such as daily rank tracking, necessary to succeed.

Daily rank tracking example keyword ranking

BrightEdge Daily Rank Tracking

  • Protect critical keywords — Get daily rank tracking alerts to see changes to high-converting keyword ranking and prioritize focus based on seasonality, industry-wide changes, algorithm updates, and website changes
  • Quickly adjust campaigns — Immediately see which campaign actions have a positive impact on content performance, to replicate that success, and which campaigns actions are to be avoided and require corrective action
  • Track site changes — Track the benefits of positive changes resulting from site or page template changes, and likewise quickly reduce any adverse impacts and restore rank performance from page template breaks
  • Comprehensive reporting — Closely monitor critical keywords in customizable dashboards ranging from keyword ranking to competitive performance on a daily, weekly, monthly, and long term basis
  • Most accurate data — Refreshed and validated multiple times a day, seven days a week, to ensure data accuracy and avoid false data from temporary fluctuations
  • Data you can trust — Don’t get stuck relying on cursory manual checks, resource intensive custom systems, and untrustworthy black hat sources. BrightEdge daily rank tracking data comes exclusively from trustworthy sources including proprietary white hat techniques, Majestic, and technology partners like Facebook, and Twitter.

Daily rank tracking and keyword ranking

We’re able to track our performance in several countries on a daily basis, which has been really valuable as we continuously update our sites.

quote

Customizable SEO Dashboards

What are customizable SEO dashboards?

Customizable dashboards are a powerful way to report and keep track of the SEO data that's most important to your organization. Gain a high level summary of your SEO efforts and find keywords your competition is ranking for that you may not have previously considered. Reporting daily, weekly, or monthly is up to you and your SEO best practices. Don't waste time on prepared dash boards as valuable information could easily be lost or unreported.

What are customizable dashboards good for?

Dashboards are used to track KPI metrics that are important to your business. In the fast-paced environment of search it’s important to quickly obtain visibility into changes in traffic and ranking performance in order to stay ahead of the competition. With an abundance of on and off-page factors that contribute to performance, it can be difficult for practitioners to parse out the data that actually affects performance from the noise and seasonal changes.

Using customizable dashboards will give you the reports and information you're looking for in one place. Customizable dashboards are good for keeping track of changing data. You can use dashboards to see how your optimization efforts are impacting rank. Create a chart with a customized date range and a specific keyword group to show how your rank changed since optimizing keyword groups that are important to your business.

Utilize dashboards to view how much traffic is coming in from each page, what kind of visitors you're receiving, how your organic traffic is doing, and how it all compares. Dashboards will give you a good idea of how your site is looking overall. You have the ability to track why there was an increase or a drop in traffic. You can then determine why traffic changed by using BrightEdge events to show updates that appear for the week they were created. You can see how many changes were made to specific pages and correlate that back to an increase in traffic and revenue. Looking back on what worked and what didn't is a simple way to plan future SEO strategies.

Why is a dashboard important?

Use dashboards for strategic planning for your SEO and visualize how you're performing head to head with competitors. Customizable dashboards are important because they help you match the exact insights you need to report on. BrightEdge StoryBuilder uses web analytics and data to give you the insights you'll use to customize for. Using customizable dashboards, you're able to gain insights into the buyer's journey and your competition. In BrightEdge StoryBuilder, you can eliminate or add competitors to gain deeper insights into who your true competition is. Easily get a leg up on your opposition by gaining these insights.

What should I add to my customizable dashboard?

Core to BrightEdge are fully customizable SEO dashboards providing instant visibility into your organization’s overall health and detailed analysis of initiatives with scheduled email delivery. Track KPIs with one-click dashboard reporting and easily communicate performance alignment across business units and with executives. Get the big picture with high-level reports for executives, tracking overall ROI from content, and dive down into the details with specialized reports around Local SEO and Blended Rank. Here are the things you'll want to customize your dashboard with:

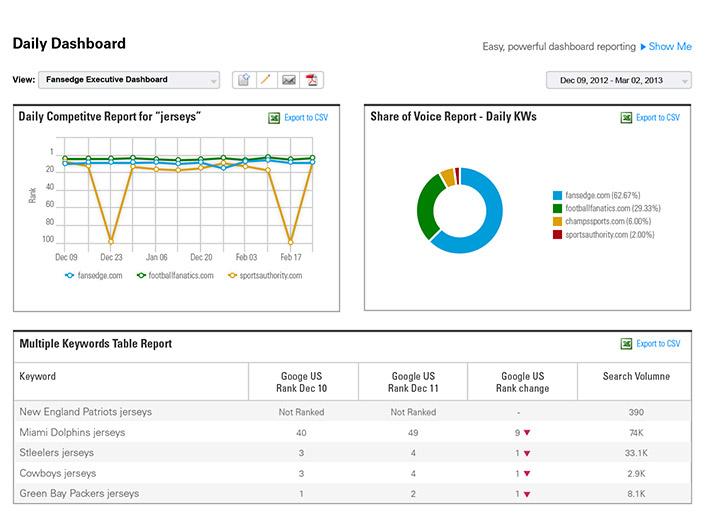
1. Flexible Dashboard Creation - Choose between an array of customizable dashboard charts including competitive trends, Share of Voice Analysis, trended keyword ranking reports, and content health snapshots

2. Leverage Proven Dashboard Templates - Start with templates based on dashboards that 6000 brands use to win in search; easily adapt them to your needs and create your own customizable dashboard. Choose templates by role such as Executive & Lead, and business needs such as social media performance and targeted campaigns

3. Easy Event Tracking - Keep track of key events such as search engine algorithm updates, start dates of major initiatives, or site redesigns. Once the event is in the system, it will automatically populate to any existing or new chart

4. Comprehensive Web Analytics Integration - Integrate third-party web analytics data into your customizable dashboards to get the complete picture of your content performance.

5. Automated & Flexible Delivery - Align team efforts with custom email delivery schedules; export entire dashboards or specific charts within your customizablr dashboard across formats such as CSV, PDF and PNG

To assist further with the structure of your dashboard, we recommending starting with a report on how your pages are performing. Next, add the devices that are sending traffic your way and then a report on how it compares to the rest of your website. Finish up the second half of your report with how rankings compare, your competition, and lastly, your keyword rank.

How do I customize my dashboard?

In the BrightEdge platform, customizing your dashboard for yourself, coworkers, the CEO, etc. can be very easy and impactful when reporting your SEO. There are several key steps to customizing your dashboard. Here are the steps:

1. Navigate to the StoryBuilder homepage in BrightEdge.

2. Create a new dashboard. You can create a new dashboard that's completely customized or use a prepopulated dashboard template that you can customize later on.

3. Name the folder. Give it a custom name that suits you and the information you plan on adding to it. If it's SEO specific, be sure to note that in the title. If it's specifically for reporting to the CEO or executive team at your company, be sure to give it a name that reflects that. Another smart way to describe your dashboard is to add the date range it will update. You can customize this portion by choosing daily, weekly, or monthly reports to look at trended information week by week or month by month.

4. Set your folder to public or private. If you're setting it to public, anyone at your company will be able to view your customized dashboard and you'll be able to easily share information about your site. If you choose to create a private dashboard, only you will be able to view it. This can be helpful while you're strategizing around what reports and charts to put in your dashboard. You can change your customizable dashboards to be public or private at any time.

5. Save your dashboard. Your data will load and populate in charts. 

6. Add customizable charts. You can search for key metrics to report on or you can scroll through to create charts. You also have the ability to create a custom story.

7. Choose a topic for your chart. In customizable dashboard stories, there are several filters to choose from to make it as customized as possible. StoryBuilder will continue to populate more and more areas for you to filter down to. This can include topics, metrics, dimensions for date ranges, rank type, device type, and more. Here, you have the ability to completely customize your report.

8. Choose a graph. This will be your final step before saving. Think about how you want your report to be viewed. Is it best seen in a graph, a flow chart, a pie chart, a table with data? Think through the dimensions you chose and pick from there.

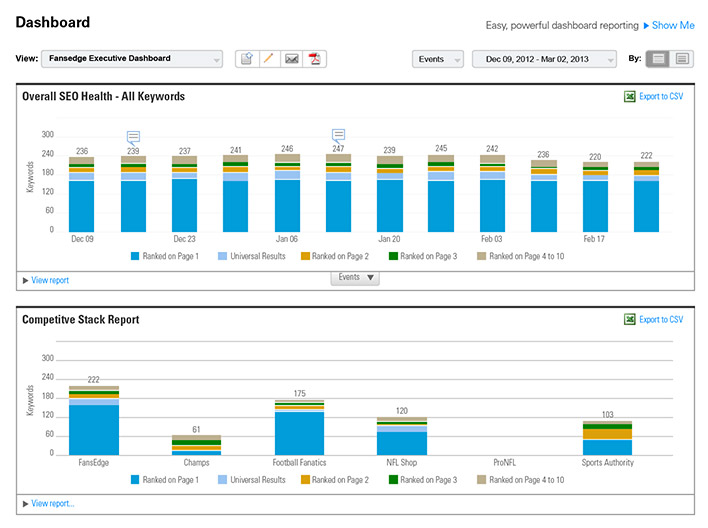
After you save your report, it will automatically populate. You can rearrange your charts once you have more than one in your customizable dashboard. Here, you'll be able to see how many keywords are ranking on page one, page two, page three, page four through ten, and pages that aren't ranked within the first ten pages which are considered 'not ranked'.

Customizable SEO Dashboards - Customizable dashboards -BrightEdge

Your customized SEO dashboards can be downloaded or delivered by email to the people you designate them to go to. Customizable dashboards can be used to included charts, graphics, images, numbers, and text. Once customized, the dashboards can serve as a content calendar. They can also prove to be helpful to track pages you need to optimize or pages you'll want to create in the future. If you create your customizable dashboard to be public, sharing with your team can be a simple and effective way to guide content creation.

If you're looking for something simple to drive your marketing performance with digital dashboards, check out our blog.

We use BrightEdge Dashboards to help inform all of our stakeholders, everyone from the executive level down to individual teams, we can build custom Dashboards populated with the data that they're most interested in, at the levels they need it.

quote
,