When AI Goes Negative on Finance Brands: How Google and ChatGPT Create Completely Different Risk Profiles in YMYL Search
Google amplifies bad headlines. ChatGPT plays devil's advocate. Finance brands need a different strategy for each.
BrightEdge data reveals that Google AI Overviews and ChatGPT both surface negative sentiment about finance brands — but for fundamentally different reasons. Google amplifies bad headlines. ChatGPT plays devil's advocate. Finance marketers need different strategies for each.
Last week, we analyzed how AI goes negative in healthcare — the highest-stakes YMYL category in search. This week, we're putting that same lens on finance: another category where both Google and ChatGPT apply extra scrutiny to the sources they cite and the claims they surface.
The patterns share some similarities with healthcare — and some characteristics that are entirely unique to financial services.
A question we keep hearing from financial services marketers: "AI is careful with finance content. YMYL protects us, right?"
Not exactly. Both engines apply extra caution to finance queries. But that caution doesn't shield brands from negative sentiment — it just shows up differently on each platform. And in finance, the negative sentiment profiles of Google AI Overviews and ChatGPT are almost mirror images of each other.
So we used BrightEdge AI Catalyst™ to analyze brand sentiment across thousands of finance prompts in both ChatGPT and Google AI Overviews — examining what types of queries trigger negativity, where in the buying journey it appears, and what finance brands need to do differently on each platform.
The short answer: Google goes negative when your news is bad. ChatGPT goes negative when your product is being evaluated. Same YMYL category, completely different risk profiles.
Data Collected
Using BrightEdge AI Catalyst™ and our Generative Parser, we analyzed:
Using BrightEdge AI Catalyst™, we analyzed:
| Data Point | Description |
| Brand sentiment in AI responses | Every brand mention classified as positive, neutral, or negative across both Google AI Overviews and ChatGPT in finance queries |
| Query intent classification | Each prompt categorized by user intent: Informational, Consideration, Branded Intent, or Transactional |
| Negative sentiment triggers | Pattern analysis identifying which query types and topics generate negative brand mentions |
| Cross-platform comparison | Head-to-head sentiment and intent analysis on finance prompts appearing in both engines |
| Evaluation query patterns | Specific analysis of "Is [brand] good?" and "Is [product] worth it?" query types across both platforms |
Key Finding
Google and ChatGPT both surface negative sentiment about finance brands — but the composition of that negativity is fundamentally different, driven by different query types, at different stages of the buying journey, and for different underlying reasons.
Google AI Overviews surfaces negative sentiment on roughly 2.4% of finance queries. ChatGPT surfaces it on roughly 4.4%. But comparing the raw rates misses the point — Google only generates AI Overviews for a portion of finance queries, while ChatGPT responds to every prompt it receives. The real insight isn't the volume. It's the shape.
On Google, 57% of negative finance sentiment appears on Informational queries — users learning about a topic and encountering headlines. On ChatGPT, 57% appears on Consideration queries — users actively evaluating options and deciding where to put their money.
Same number. Completely opposite intent. That's the story.
Two Engines, Two Kinds of Negativity
Google AI Overviews: Negative When the News Is Bad
Google's AI goes negative on finance brands primarily through news-cycle amplification. Lawsuits, data breaches, branch closures, regulatory actions, and below-market rates drive the majority of negative sentiment on the platform.
The pattern is recognizable from traditional PR: a single negative news event generates AI responses across multiple related queries, extending the tail of reputational damage well beyond a normal news cycle. A data breach doesn't just surface on the breach-specific query — it shows up on queries about online banking, account security, and even general savings rate comparisons for that institution.
Roughly 10% of Google's negative finance queries trace directly back to lawsuits, breaches, or regulatory issues. Another significant share comes from rates and fees queries — when a user asks about a specific institution's savings or CD rates and those rates fall below competitive benchmarks, Google's AI flags it. This isn't scandal. It's AI doing comparison shopping on the user's behalf.
ChatGPT: Negative When the Product Is Being Evaluated
ChatGPT's negative sentiment profile looks completely different. The dominant pattern is what we're calling the "Is X Good?" gauntlet — evaluation queries where users ask ChatGPT to render a judgment on a financial institution or product.
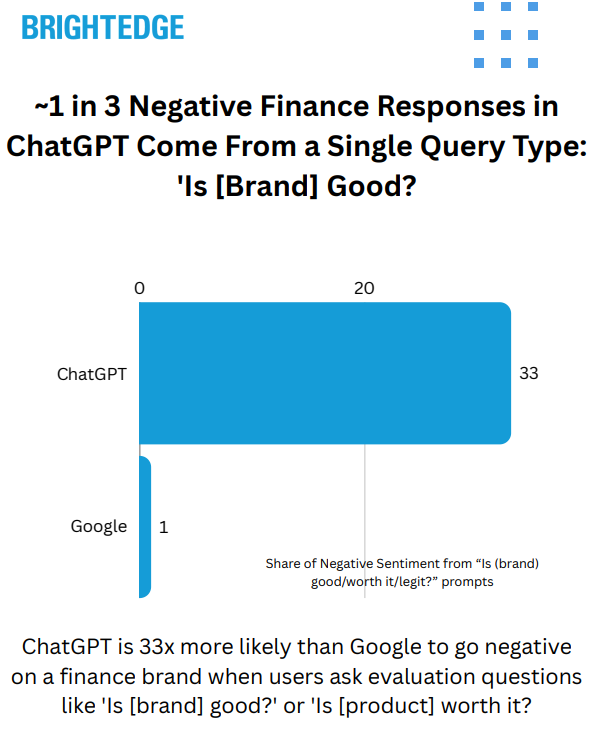
"Is [bank] a good bank?" "Is [product] worth it?" "Is [service] legit?" — roughly one-third of all negative sentiment in ChatGPT comes from this single query pattern. It's the largest source of negative finance sentiment on either platform, and it barely exists on Google.
When users ask ChatGPT these evaluation questions, it synthesizes review platform data and presents a balanced "pros and cons" response. That structure inherently introduces negativity — even for strong brands. ChatGPT is 33x more likely than Google to go negative on a finance brand when users ask evaluation questions.
Where in the Buying Journey Does AI Go Negative?
The intent breakdown reveals how differently these platforms create brand risk:
Google AI Overviews — Negative Sentiment by Intent
| Intent | Share of Negative Queries |
| Informational | 57% |
| Consideration | 27% |
| Branded Intent | 9% |
| Transactional | 7% |
ChatGPT — Negative Sentiment by Intent
| Intent | Share of Negative Queries |
| Consideration | 57% |
| Informational | 36% |
| Branded Intent | 4% |
| Transactional | 3% |
Google goes negative early in the journey — when users are still learning about a topic and encountering headlines. ChatGPT goes negative at the point of decision — when users are actively comparing options and deciding where to put their money.
The implications are significant. Google's negativity affects brand perception and awareness. ChatGPT's negativity affects purchase decisions. Different stage, different business impact, different remediation strategy.
The 5 Risk Zones for Finance Brands
When we categorize the types of queries that trigger negative brand sentiment in finance, five distinct patterns emerge — each weighted differently across the two platforms.
1. The "Is X Good?" Gauntlet (ChatGPT-Heavy)
The single largest source of negative finance sentiment. When users ask ChatGPT to evaluate a financial institution or product, it pulls from review platforms and consumer advocacy sites to build a balanced response. Even strong brands get dinged. This pattern drives approximately one-third of all negative sentiment on ChatGPT, compared to less than 2% on Google.
Example query patterns: "Is [bank] a good bank?" "Is [credit card] worth it?" "Is [financial service] legit?" "Is [investment product] a good investment?"
2. Rates as Implicit Criticism (Both Engines)
When someone asks about a specific institution's savings rate, CD rate, or money market rate and those rates fall below competitive benchmarks, both engines flag the brand negatively. This accounts for approximately 7–8% of negative queries on both platforms.
The mechanism is subtle but powerful: AI is essentially doing real-time comparison shopping for the user. No scandal required — just a product that doesn't measure up on the metric the user is asking about.
Example query patterns: "[Institution] savings account interest rate" "[Institution] CD rates" "[Institution] money market rates" "Which bank offers the highest interest rate?"
3. News-Cycle Amplification (Google-Heavy)
About 10% of Google's negative finance queries trace back to lawsuits, data breaches, regulatory actions, or institutional crises. The risk isn't just the initial story — it's the persistence. A single negative event generates AI responses across dozens of related queries, and those responses stick long after traditional news coverage fades.
What makes this pattern particularly dangerous in finance is the breadth of query contamination. A data breach story doesn't just appear on "[institution] data breach" — it surfaces on queries about that institution's online banking, account security, and general trustworthiness.
Example query patterns: "[Institution] lawsuit" "[Institution] data breach" "[Institution] branch closures" "[Payment platform] fraud"
4. Product Gap Exposure (ChatGPT-Heavy)
When a user asks "Does [institution] offer [product]?" and the answer is no or the offering is limited, ChatGPT frames that absence as a negative. This pattern showed up repeatedly across personal loans, high-yield savings accounts, and specialty financial products.
This is a uniquely ChatGPT-driven risk because of how the platform structures its responses. Google AI Overviews tends to answer the question factually. ChatGPT contextualizes the gap — explaining not just that the institution doesn't offer the product, but what that means for the user and where they should look instead.
Example query patterns: "Does [institution] offer personal loans?" "Does [institution] have a high-yield savings account?" "[Institution] [product type]" when the product doesn't exist
5. Consideration-Phase Comparison Shopping (ChatGPT-Heavy)
Over half of ChatGPT's negative finance queries fall under Consideration intent — users asking "which bank has the best..." or "what's the best [financial product]." When AI ranks options, brands that don't come out on top get implicitly or explicitly dinged.
The sources ChatGPT leans on for these comparisons are primarily review platforms, consumer finance publishers, and editorial rankings — third-party sources the brand may not be actively managing.
Example query patterns: "Which bank has the best savings rate?" "What's the best credit card for travel?" "Who has the best high-yield savings account?" "Best bank for [specific need]"
Healthcare vs. Finance: Same YMYL Framework, Different Fingerprints
Last week's healthcare analysis revealed that negative AI sentiment is driven almost entirely by safety signals — pregnancy contraindications, drug interactions, long-term risk disclosures. It's institutional sources saying cautionary things about specific products, and AI faithfully surfacing those warnings.
Finance follows a fundamentally different pattern. Negative sentiment isn't safety-driven — it's evaluation-driven. AI goes negative when it's assessing whether a brand, product, or rate is competitive. The triggers aren't warnings from medical authorities; they're review platform ratings, below-market rates, and product gaps.
| Dimension | Healthcare | Finance |
| Primary negative trigger | Safety warnings from institutional sources | Product evaluation and competitive comparison |
| What gets dinged | Consumer products (OTC/pharma) | Financial institutions and their products |
| Who's protected | Hospital systems (0.1% negative rate) | No structural protection — all institutions are evaluated |
| Biggest risk query type | "Can I take X while pregnant?" | "Is [institution] good?" |
| Platform split | Similar patterns on both engines | Mirror-image patterns — Google is news-driven, ChatGPT is evaluation-driven |
| Remediation | Publish safety content so AI uses your language | Manage review presence and product competitiveness |
The structural takeaway: in healthcare, AI goes negative when institutional sources say something cautionary about a product. In finance, AI goes negative when it evaluates whether your brand — and your products — measure up.
What This Means for Your Finance Brand Strategy
Google and ChatGPT require two different strategies. Google's negative sentiment is a PR and reputation management problem — monitor how AI Overviews surface your news cycle and for how long. ChatGPT's negative sentiment is a product competitiveness and review management problem — the evaluation queries aren't going away, and AI is pulling from sources you may not be actively managing.
Evaluation queries are the single biggest risk zone. "Is [brand] good?" and "Is [product] worth it?" drive roughly a third of all negative sentiment on ChatGPT. If your rates, products, or customer experience aren't competitive, AI will surface that at the exact moment a prospective customer is deciding where to go. This is the highest-impact negative sentiment in finance AI because it appears at the point of decision.
AI exposes product gaps by name. When users ask whether your institution offers a product and the answer is no, ChatGPT frames that absence as a negative. Map your product suite against the queries users are asking and know where you have holes before AI tells your prospects.
Own your review presence before AI uses it against you. ChatGPT leans heavily on review platforms and consumer finance publishers when constructing evaluation responses. The brand's presence on these third-party platforms is the raw material AI works with. Managing those profiles isn't just a customer satisfaction exercise — it's an AI search strategy.
Monitor both platforms — they tell opposite stories. A brand's AI sentiment on Google can look completely different from its sentiment on ChatGPT. Google may show clean results while ChatGPT surfaces review-driven criticism, or vice versa. A single-platform monitoring approach will miss half the picture.
The news cycle has a longer tail in AI. When negative news hits, Google AI Overviews doesn't just surface it once — it distributes that story across multiple related queries and keeps it visible well beyond the typical news cycle. Financial institutions need to understand which queries are contaminated by a negative story and plan content responses accordingly.
Technical Methodology
| Parameter | Detail |
| Data Source | BrightEdge AI Catalyst™ |
| Engines Analyzed | Google AI Overviews, ChatGPT |
| Query Set | Thousands of finance-related prompts spanning banking, investing, lending, insurance, and personal finance |
| Sentiment Classification | Brand-level sentiment (positive, neutral, negative) for every brand mentioned in finance AI responses |
| Intent Classification | Each prompt categorized as Informational, Consideration, Branded Intent, or Transactional |
| Negative Pattern Analysis | Categorization of negative-sentiment queries by trigger type: evaluation, rates/fees, news-cycle, product gaps, and comparison shopping |
| Cross-Platform Comparison | Head-to-head sentiment and intent analysis on finance prompts appearing in both engines |
Key Takeaways
| Finding | Detail |
| Two Engines, Two Risk Profiles | Google goes negative when news is bad (57% Informational). ChatGPT goes negative when products are evaluated (57% Consideration). Mirror-image intent patterns. |
| "Is X Good?" Dominates ChatGPT Negativity | Evaluation queries drive ~33% of all ChatGPT negative finance sentiment — and ChatGPT is 33x more likely than Google to go negative on these queries. |
| 5 Predictable Risk Zones | Evaluation queries, below-market rates, news-cycle amplification, product gap exposure, and consideration-phase comparison shopping. Each weighted differently by platform. |
| Finance ≠ Healthcare | Healthcare negativity is safety-driven (pregnancy, drug interactions). Finance negativity is evaluation-driven (competitive comparisons, review data). Same YMYL framework, different fingerprints. |
| ChatGPT Goes Negative at Point of Decision | Over half of ChatGPT's negative finance sentiment appears on Consideration-intent queries — when users are actively choosing where to put their money. |
| News Cycle Has a Longer Tail in AI | A single negative story generates AI responses across dozens of related queries on Google, extending reputational impact well beyond the normal news cycle. |
| Review Platforms Power ChatGPT's Negativity | ChatGPT pulls from review sites and consumer finance publishers when constructing evaluation responses. Managing those profiles is now an AI search strategy, not just a customer satisfaction exercise. |
Download the Full Report
Download the full AI Search Report — When AI Goes Negative on Finance Brands: How Google and ChatGPT Create Completely Different Risk Profiles in YMYL Search
Click the button above to download the full report in PDF format.
Published on March 11, 2026
When AI Goes Negative in Healthcare: The Safety Signals That Trigger Brand Criticism in YMYL Search
BrightEdge data reveals that AI treats healthcare brands very differently depending on their category — and negative sentiment, while rare, follows predictable safety-driven patterns that consumer health brands need to understand.
BrightEdge data reveals that AI treats healthcare brands very differently depending on their category — and negative sentiment, while rare, follows predictable safety-driven patterns that consumer health brands need to understand.
BrightEdge data reveals that when AI engines mention healthcare brands negatively, it's almost never random — it's driven by safety signals. And the gap between how AI treats different types of healthcare sources is dramatic: OTC and pharmaceutical brands are 58x more likely to receive negative sentiment than hospital systems.
Healthcare is the highest-stakes category in AI search. Both Google AI Overviews and ChatGPT treat it as YMYL (Your Money or Your Life) content, applying extra scrutiny to the sources they cite and the claims they surface. AI Overviews now appear on approximately 88% of tracked healthcare queries, and ChatGPT generates an AI response for every query it receives. Both platforms are actively shaping how consumers understand health brands, medications, and institutions at scale.
But YMYL caution doesn't mean brand safety. When AI surfaces contraindications, safety warnings, or adverse effect data, it names specific products — and that creates a sentiment exposure that many healthcare and pharma marketers aren't yet tracking.
So we used BrightEdge AI Catalyst™ to find out what triggers negative sentiment in healthcare AI, who's most at risk, and where Google draws the line on which health topics get an AI-generated answer at all.
The short answer: AI treats healthcare institutions as trusted authorities. Consumer product brands don't get the same protection — especially on safety-related queries.
Data Collected
Using BrightEdge AI Catalyst™, we analyzed:
| Data Point | Description |
| Brand sentiment in AI responses | Every brand mention classified as positive, neutral, or negative across both Google AI Overviews and ChatGPT in healthcare queries |
| Citation patterns | Which source types each platform cites for healthcare queries and how citation concentration differs |
| Brand mention visibility | Which healthcare domains are explicitly named in AI-generated responses |
| Sensitive topic analysis | How both platforms handle pregnancy, drug interaction, mental health, sexual health, pediatric, and substance use queries |
| AIO deployment rates | Which healthcare specialties and topic areas trigger AI Overviews — and which Google leaves to traditional organic results |
| Cross-platform comparison | Head-to-head sentiment and citation analysis on healthcare prompts appearing in both engines |
Key Finding
Negative brand sentiment in healthcare AI is rare — but it's structurally concentrated on consumer product brands, triggered almost exclusively by safety-related queries, and absent from institutional sources.
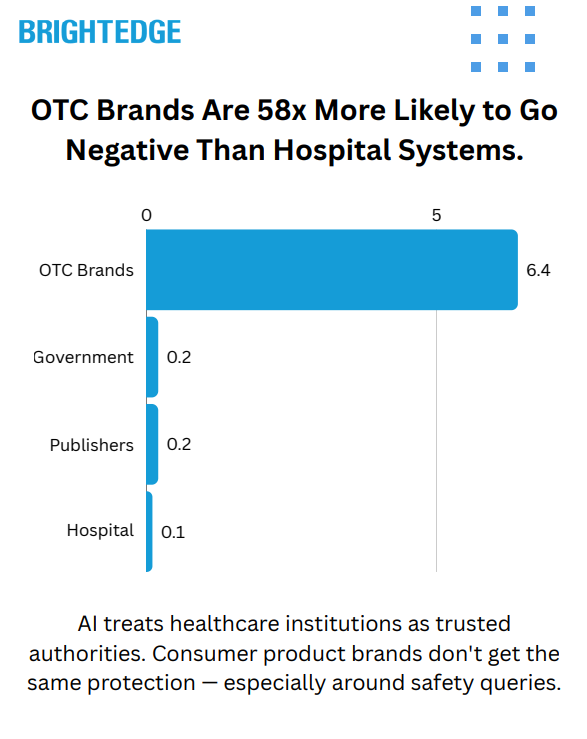
Across both engines, negative brand mentions represent a small share of total healthcare AI references — under 0.5% of all brand mentions carry negative sentiment. But that small percentage is not distributed evenly. OTC and pharmaceutical brands absorb negative sentiment at a rate of 6.4%, while hospital and health systems see just 0.1%. That's a 58x gap.
And the triggers are almost entirely safety-driven: pregnancy contraindications, drug interaction warnings, long-term risk disclosures, and dubious health claim flagging account for the majority of identifiable negative sentiment. AI isn't editorializing about healthcare brands — it's surfacing institutional safety warnings and attaching them to specific products.
The Trust Hierarchy: Not All Healthcare Brands Are Equal
Both platforms treat healthcare sources with a clear hierarchy, and the gap between the top and bottom is enormous.
| Source Category | Positive Rate | Neutral Rate | Negative Rate |
| Hospital / Health Systems | 63.6% | 36.3% | 0.1% |
| Health Publishers | 51.0% | 48.8% | 0.2% |
| Government Sources | 45.0% | 54.8% | 0.2% |
| OTC / Consumer Health Brands | 35.8% | 63.5% | 0.7% |
Hospital and health systems sit at the top of the trust hierarchy on both platforms. They're not just cited frequently — they're framed positively at a higher rate than any other category. At 63.6% positive sentiment in ChatGPT, hospital systems are the most "recommended" source type in healthcare AI.
Government sources skew more neutral — they're treated as informational authorities rather than explicitly endorsed. This reflects an interesting editorial distinction: AI trusts government sources for facts but reserves its strongest positive framing for hospital systems.
OTC and consumer health brands sit at the bottom on every metric. Lower positive rates, higher neutral rates, and a negative rate that dwarfs every other category. When we isolate just the negative rate, the disparity is stark:
| Source Category | Negative Sentiment Rate |
| OTC / Pharmaceutical Brands | 6.4% |
| Tabloid / Lifestyle Media | 3.4% |
| Health Publishers | 0.25% |
| Government / Medical Associations | 0.20% |
| Hospital / Health Systems | 0.11% |
OTC brands face 58x the negative sentiment rate of hospital systems. This isn't a small difference in degree — it's a structural feature of how AI evaluates different types of healthcare authority.
Platform Differences: ChatGPT Is More Opinionated
While both platforms show the same trust hierarchy, they differ in how strongly they express it:
| Metric | ChatGPT | Google AI Overviews |
| Overall positive rate | 45.1% | 33.5% |
| Overall neutral rate | 54.5% | 66.2% |
| Overall negative rate | 0.4% | 0.3% |
| Avg. brands mentioned per response | 5.8 | 3.8 |
| Top 10 domain citation share | 34.3% | 40.1% |
ChatGPT is more willing to take a position — both positive and negative. It frames sources more favorably, mentions more brands per response, and distributes citations more broadly. Google AI Overviews is more conservative: more neutral, fewer sources per response, and higher concentration on a smaller set of trusted domains.
For healthcare organizations, this creates a strategic split. ChatGPT offers more pathways to visibility (more brands cited, more broadly distributed), but also more editorial exposure. Google AI Overviews is harder to break into but more predictable once you're there.
One brand mention pattern is particularly striking. When we look at which brands are explicitly named in AI responses (not just linked, but mentioned by name), a single UK government health service captures 92.6% of all brand visibility in Google AI Overviews — and 68.1% in ChatGPT. Google's trust in government health authorities, when it comes to naming sources, is nearly monopolistic.
The 4 Safety Signals That Trigger Negative Sentiment
When AI does go negative on a healthcare brand, it follows predictable patterns. Nearly all identifiable negative sentiment traces back to safety-related queries — AI surfacing institutional warnings about specific products.
| Trigger Category | Share of Identifiable Negative Mentions |
| Drug Interactions / Dosing Concerns | 14% |
| Pregnancy / Maternal Safety | 13% |
| Quick-Fix / Dubious Health Claims | 7% |
| Long-Term Risk / Side Effects | 3% |
| Substance Effects | 2% |
1. Pregnancy and Maternal Safety
The single largest identifiable trigger. When users ask whether a medication or supplement is safe during pregnancy or breastfeeding, AI cites institutional contraindication guidance — and names the product negatively. Pain relievers, sleep aids, nasal sprays, and cold medications are the most frequent targets.
The pattern is consistent: AI references hospital systems and government health agencies as the authority, and the consumer product takes the negative sentiment hit. The institution providing the warning gets positive or neutral sentiment; the product being warned about gets the negative tag.
Example query patterns: "Can you take [pain reliever] while pregnant?" "What nose spray can I use while breastfeeding?" "What teas are safe during pregnancy?"
2. Drug Interaction and Dosing Concerns
The second major trigger. Queries about combining medications, appropriate dosing, or daily use safety generate negative mentions for the products in question. AI cites medical institutions and government agencies warning about overuse or interaction risks.
Sleep supplements are particularly exposed here — queries about how many to take, whether daily use is safe, and interaction with other medications consistently surface negative sentiment for the product brand while citing hospital systems positively.
Example query patterns: "How many [sleep supplement] gummies should I take?" "Is it OK to take [sleep aid] every night?" "What can I take for arthritis pain while on [blood thinner]?"
3. Long-Term Risk Disclosures
When users ask about the long-term effects of specific medications, AI surfaces published research linking products to adverse outcomes. Certain antihistamines appear negatively in connection with cognitive risk in elderly populations. Statins appear in blood sugar effect discussions. The AI is citing peer-reviewed research — but the brand absorbs the negative sentiment frame.
This is a particularly difficult exposure for pharmaceutical brands because the negativity is evidence-based. AI is accurately representing published research findings, but the brand association is what sticks in the AI-generated response.
Example query patterns: "Medications that increase risk of Alzheimer's" "Long-term use of [benzodiazepine] in the elderly" "Which statin does not raise blood sugar?"
4. Dubious Health Claims
A smaller but notable pattern: tabloid-style health publishers and lifestyle media occasionally receive negative sentiment when AI flags their claims as lacking evidence. Quick-fix health content — "lose belly fat in 1 week," "cure [condition] naturally in 7 days" — gets called out when AI notes the claims aren't supported by medical evidence.
This trigger is unique because it targets content sources rather than products. AI is functioning as a quality filter, distinguishing between evidence-based health information and sensationalized health content.
Example query patterns: "How to lose belly fat naturally in 1 week?" "How to get rid of [condition] fast?"
Where Google Won't Even Use AI: The AIO Deployment Gap
Beyond sentiment, there's a separate dimension of AI caution in healthcare: the topics where Google declines to generate an AI Overview at all, leaving the answer to traditional organic results.
AI Overviews appear on approximately 88% of healthcare queries overall, but the rate varies dramatically by specialty and topic area:
| Healthcare Topic | AIO Deployment Rate |
| Gastroenterology | 95.1% |
| Orthopedics | 94.1% |
| Neurology | 94.2% |
| Urology | 93.8% |
| Cardiology | 92.8% |
| Genetics | 89.3% |
| Primary Care | 68.7% |
| Telehealth | 66.7% |
| Eating Disorders | 65.1% |
| Bullying / Behavioral Health | 65.1% |
The pattern is clear: the more emotionally sensitive the health topic, the less likely Google is to deploy an AI-generated summary. Clinical specialties cluster between 93–95% AIO deployment. But eating disorders, bullying, and behavioral health drop to 65% — a 30-percentage-point gap.
Among the specific queries Google avoids answering with AI: domestic violence, emotional abuse, body dysmorphia treatment, binge eating disorder treatment, and substance abuse topics.
The ~12% of healthcare keywords without AI Overviews cluster into recognizable patterns:
| Non-AIO Pattern | Share of Excluded Keywords |
| Local / navigational queries | ~11% |
| Abuse and violence topics | ~9% |
| Visual / diagnostic queries | ~7% |
| Body image and eating disorders | ~7% |
| Branded / facility-specific | ~3% |
This deployment gap has direct implications for SEO strategy. For behavioral health topics, traditional organic rankings carry disproportionate weight because Google frequently isn't generating an AI summary to compete with. These are the queries where organic SEO still dominates the user experience.
Sensitive Topic Handling: Both Platforms Engage, Differently
Both platforms engage with sensitive healthcare topics at broadly similar rates — the difference is in how many sources they involve and how they frame the answers.
| Sensitive Topic | ChatGPT Query Share | Google AIO Query Share |
| Sexual Health / STIs | 3.5% | 3.1% |
| Pregnancy / Maternal Health | 2.4% | 2.4% |
| Drug Interactions | 2.2% | 3.2% |
| Mental Health | 1.4% | 2.2% |
| Substance Use / Addiction | 1.4% | 1.1% |
| Pediatric Health | 1.0% | 1.2% |
Google AI Overviews shows slightly higher engagement on drug interaction and mental health queries, while ChatGPT shows slightly higher engagement on sexual health and substance use topics. But the key structural difference is that ChatGPT includes 5.8 brands per response vs. 3.8 for Google — giving users more reference points and distributing trust across more organizations for every sensitive query.
Cross-referencing with AIO deployment data reveals the nuance: while Google does answer most sensitive health queries with an AI Overview, it draws clearer lines around abuse, violence, and eating disorder content — where AIO rates drop 30 points below the clinical specialty average.
What This Means for Your Healthcare Brand Strategy
OTC and Pharma Brands Carry the Most Exposure. At 6.4% negative sentiment — 58x the rate of hospital systems — consumer health brands are the primary target when AI surfaces healthcare criticism. This isn't random editorial judgment; it's AI faithfully reflecting what institutional sources say about specific products in safety contexts. The risk is concentrated and predictable.
Safety Queries Are the Trigger — and They're Identifiable. Pregnancy safety, drug interactions, long-term risk disclosures, and dubious health claims account for the majority of identifiable negative sentiment. Brands can map exactly which of their products sit in these query spaces and prioritize proactive safety content accordingly.
Own the Narrative Before AI Writes It for You. When AI goes negative on a consumer health product, it's citing someone else's warning — a hospital system, a government agency, a peer-reviewed study. The brand that publishes transparent, comprehensive safety guidance gives AI its own language to use. The brand that doesn't leaves the characterization to third parties.
Hospital Systems Are in the Strongest Position. With a 0.1% negative rate and 63.6% positive sentiment, hospital and health systems are the most trusted, most favorably framed source category in healthcare AI. The priority for these organizations isn't defending against negativity — it's ensuring they're in the citation set.
Behavioral Health Requires a Different Strategy. The 30-point AIO gap on eating disorders, bullying, and abuse content means traditional organic SEO carries outsized importance for behavioral health organizations. These topics also represent an opportunity in ChatGPT, which does answer these queries and cites broadly.
Monitor Both Platforms — They Tell Different Stories. ChatGPT is more opinionated (higher positive and negative rates) and cites more broadly (5.8 brands per response). Google AI Overviews is more conservative (more neutral) and more concentrated (top 10 domains capture 40.1% of citations). A brand's reputation in one platform may look completely different in the other.
Technical Methodology
| Parameter | Detail |
| Data Source | BrightEdge AI Catalyst™ |
| Engines Analyzed | Google AI Overviews, ChatGPT |
| Sentiment Classification | Brand-level sentiment (positive, neutral, negative) for every brand mentioned in healthcare AI responses |
| Citation Analysis | Domain-level citation tracking including visibility share, citation concentration, and source categorization |
| AIO Deployment Tracking | Separate multi-specialty healthcare keyword set tracking AI Overview presence/absence across clinical and general health categories |
| Topic Categories | Healthcare specialties (gastroenterology, orthopedics, neurology, urology, cardiology, genetics), general health (primary care, behavioral health, eating disorders, telehealth) |
| Sensitive Topic Classification | Pregnancy/maternal, drug interactions, mental health, sexual health/STIs, pediatric, substance use |
Key Takeaways
| Finding | Detail |
| 58x Negative Sentiment Gap | OTC/pharma brands face a 6.4% negative rate vs. 0.1% for hospital systems. AI structurally favors institutional healthcare sources over consumer product brands. |
| 4 Predictable Safety Triggers | Pregnancy safety, drug interactions, long-term risk disclosures, and dubious health claims drive the majority of identifiable negative sentiment. All are safety-signal driven. |
| Hospital Systems Are Most Trusted | 63.6% positive sentiment — the highest of any source category. AI treats hospital systems as the most recommended, most authoritative healthcare source. |
| Government Sources Dominate Brand Mentions | A single UK government health service captures 92.6% of Google AIO brand mentions and 68.1% of ChatGPT mentions — near-monopoly status. |
| 88% of Healthcare Queries Get AI Overviews | But behavioral health topics (eating disorders, bullying, abuse) drop to 65%. A 30-point gap where organic SEO still dominates. |
| ChatGPT Distributes Trust More Broadly | 5.8 brands per response vs. 3.8 for Google. Lower citation concentration. More pathways to visibility for a wider range of healthcare organizations. |
Download the Full Report
Download the full AI Search Report — When AI Goes Negative in Healthcare: The Safety Signals That Trigger Brand Criticism in YMYL Search
Click the button above to download the full report in PDF format.
Published on February 26, 2026
When AI Goes Negative in Healthcare: The Safety Signals That Trigger Brand Criticism in YMYL Search
When AI Goes Negative: How Google AI Overviews and ChatGPT Handle Brand Criticism Differently
BrightEdge data shows that Google and ChatGPT surface negative brand mentions very differently across industries. Knowing where and why this happens is the next frontier of AI search optimization.
BrightEdge data reveals that when AI engines mention brands negatively, Google and ChatGPT follow fundamentally different patterns — and it varies dramatically by industry. Understanding where and why negative sentiment appears is the next frontier of AI search optimization.
As AI Overviews and ChatGPT play an increasingly central role in how consumers research products and make purchasing decisions, one question keeps surfacing in conversations with marketing leaders: if AI is going to talk about our brand, what happens when it says something we don't like?
It's the right question. AI engines are now mentioning brands by name across billions of queries — recommending, comparing, and evaluating them in real time. But that also means they can surface criticism, flag limitations, or steer users toward competitors. Until now, there hasn't been much data on how often this actually happens, what triggers it, or whether different AI engines handle it differently.
So we used BrightEdge AI Catalyst™ to find out. We analyzed prompts across Google AI Overviews and ChatGPT in three industries — Apparel, Electronics, and Education — and tracked every brand mention and its sentiment. We then compared the two engines head-to-head to understand whether they go negative on the same queries, the same brands, and for the same reasons.
The short answer: they don't.
Data Collected
Using BrightEdge AI Catalyst™, we analyzed:
| Data Point | Description |
| Brand sentiment in AI responses | Every brand mention classified as positive, neutral, or negative across both Google AI Overviews and ChatGPT |
| Primary response sentiment | The overall sentiment posture of each AI-generated response |
| Intent classification | Search intent behind each prompt (Informational, Consideration, Transactional, Post Purchase, Branded Intent) |
| Industry segmentation | Separate analysis across Apparel, Electronics, and Education verticals |
| Cross-engine comparison | Head-to-head sentiment analysis on overlapping prompts appearing in both engines |
Key Finding
Negative brand sentiment in AI is rare — but it's real, it's concentrated in predictable query patterns, and Google and ChatGPT go negative for fundamentally different reasons.
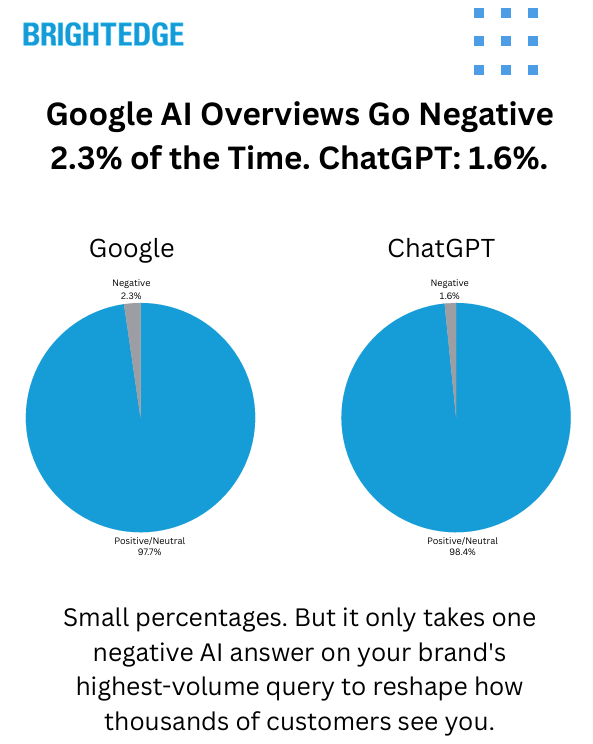
Across both engines, negative brand mentions represent a small share of total AI-generated brand references — 2.3% for Google AI Overviews and 1.6% for ChatGPT. But that small percentage is concentrated in specific, high-visibility query types. And when we compared the two engines side by side, the most striking finding wasn't how often they go negative — it was how differently they do it.
Google AI Overviews behaves like an investigative reporter, surfacing negativity around controversies, lawsuits, product recalls, and news-driven events. ChatGPT behaves like a product advisor, more likely to go negative around product limitations, compatibility issues, and evaluative "is it worth it?" queries. The same brand can be treated positively by one engine and negatively by the other — on the same query.
Overall Negative Sentiment: Small but Meaningful
Across both engines, the vast majority of brand mentions are positive or neutral. But negative sentiment, while a small share, is present and consistent:
| Engine | Positive | Neutral | Negative |
| Google AI Overviews | 49.9% | 47.7% | 2.3% |
| ChatGPT | 43.9% | 54.4% | 1.6% |
Google AI Overviews is 44% more likely than ChatGPT to mention a brand negatively. ChatGPT skews more neutral overall — it mentions more brands but takes fewer editorial positions on them, positive or negative.
Another way to frame it: Google's positive-to-negative ratio is roughly 21:1. ChatGPT's is 27:1. Both engines overwhelmingly speak positively about brands — but Google is measurably more willing to surface criticism when it does take a position.
Two Engines, Two Editorial Personalities
This is the core finding. When we isolated the prompts where only one engine went negative (the other stayed neutral or positive on the same query), clear patterns emerged in what triggers negativity for each engine.
Among identifiable negative sentiment triggers:
| Trigger Category | Share of Categorized Negatives |
| Brand Controversies & Legal Issues | 32% |
| Product Limitations & Compatibility | 21% |
| Safety & Recalls | 17% |
| Service Failures & Outages | 11% |
| Product Discontinuation | 9% |
| Price & Value Criticism | 8% |
| Competitive Comparisons | 3% |
Controversies, legal issues, and safety recalls account for the majority of identifiable negative sentiment across both engines combined. But when we split by engine, the editorial personalities diverge sharply:
Google AI Overviews skews heavily toward controversy-driven negativity. When Google goes negative and ChatGPT doesn't, the triggers are overwhelmingly news-driven — lawsuits, boycotts, data breaches, regulatory actions, product recalls. Google is 4.5x more likely than ChatGPT to surface negative brand sentiment tied to news and controversy.
ChatGPT skews toward product evaluation negativity. When ChatGPT goes negative and Google doesn't, the triggers are typically product-focused — compatibility limitations, feature shortcomings, "is it worth it?" assessments. ChatGPT is 3x more likely than Google to go negative on product evaluation queries.
In practical terms: a major retailer might face negative sentiment in Google AI Overviews because of a news story about a lawsuit — while in ChatGPT, the same retailer might face negative sentiment because a user asked whether they accept a specific payment method and the answer is no. Same brand, different engine, different reason for criticism, different risk to manage.
The Same Query, Different Verdict
We identified overlapping prompts that appeared in both engines and carried negative brand sentiment in both. Among those overlapping negative prompts, the two engines disagreed on which brand to flag 73% of the time.
This means that even when both engines recognize a query as carrying negative implications, they frequently assign that negativity to different brands within the same response. One engine might flag the retailer; the other might flag the payment provider. One might criticize the platform; the other might criticize the manufacturer.
Tracking your brand's sentiment on one AI engine gives you, at best, half the picture. The other engine may be telling a completely different story about your brand — on the same query.
Industry Breakdown: No One-Size-Fits-All
Negative sentiment rates vary significantly across the three industries we analyzed, and the relative positioning of Google vs. ChatGPT shifts depending on the vertical.
| Industry | Google AI Overviews | ChatGPT | More Negative Engine |
| Electronics | 2.5% | 1.7% | Google (1.5x) |
| Education | 2.5% | 1.4% | Google (1.8x) |
| Apparel | 0.2% | 0.6% | ChatGPT (3x) ← |
Electronics sees the highest overall negative sentiment rates, driven by product recall coverage, service outage queries, and technology controversy topics. Google leads here because there's significant news and controversy activity for Google to surface.
Education shows a similar pattern, with Google nearly twice as negative as ChatGPT. This is driven largely by institutional and political scrutiny queries — funding decisions, policy controversies, and regulatory actions affecting educational institutions.
Apparel is where the pattern flips entirely. ChatGPT is 3x more negative than Google in Apparel — not because there's more controversy, but because there's less. With fewer lawsuits and recalls for Google to report, the dominant negative triggers in Apparel are product evaluation queries: "Is this shoe good for running?" "Is this fabric durable?" These are the types of questions where ChatGPT is more willing to deliver a critical verdict.
This reversal illustrates why industry-level monitoring matters. A brand monitoring only one engine, or benchmarking against cross-industry averages, would miss the dynamics specific to their vertical.
Where Negative Sentiment Appears in the Buying Journey
The intent distribution of negative-sentiment AI responses reveals where in the customer journey brands are most exposed to AI criticism:
| Intent Type | All Prompts | Negatives (Google) | Negatives (ChatGPT) |
| Informational | 58.7% | 85.1% | 68.5% |
| Consideration | 14.1% | 1.5% | 19.4% |
| Transactional | 8.8% | 1.5% | 4.7% |
| Post Purchase | 8.8% | 0.7% | 3.7% |
| Branded Intent | 5.3% | 4.5% | 3.6% |
Google's negative sentiment is overwhelmingly concentrated in the informational phase — 85% of negative-sentiment AI Overviews appear on informational queries. This is the research and discovery stage, where users are forming impressions and evaluating options before making a decision.
ChatGPT distributes its negative sentiment more broadly. While informational queries still dominate (68.5%), ChatGPT shows meaningfully more negative sentiment in the consideration phase (19.4% vs. Google's 1.5%). This means ChatGPT is more willing to surface brand criticism closer to the point of purchase — when a user is actively evaluating options.
For brands, this distinction matters. Google's negativity hits during early research, potentially shaping initial perceptions. ChatGPT's negativity extends further into the decision-making process, where it may more directly influence purchase choices.
The Balanced Evaluator Pattern
Beyond simple negative mentions, we identified a distinct pattern where AI engines present both positive and negative brand sentiment within the same response — actively praising some brands while flagging limitations of others.
Approximately 1.4% of all prompts with brand mentions showed this mixed-sentiment pattern. These are the moments where AI is functioning as an editorial evaluator, making real-time brand-versus-brand judgments within a single answer.
| Scenario | What the AI Does |
| Compatibility queries | Praises alternative solutions while flagging limitations of the product the user asked about |
| Discontinued product queries | Speaks negatively about the discontinued brand while positively recommending current alternatives |
| Evaluative queries | Highlights strengths of category leaders while noting shortcomings of the specific brand in question |
This pattern represents AI moving beyond simple question-answering into active brand arbitration — a dynamic that didn't exist in traditional organic search results.
What This Means for Your Brand Strategy
Negative Sentiment Is Rare but Concentrated. At 1.6%–2.3% of brand mentions, negative sentiment is not the dominant AI experience. But it clusters around specific, predictable query types. Brands don't need to worry about everything, but they do need to know which queries put them at risk.
Each Engine Requires Its Own Monitoring. Google and ChatGPT go negative for different reasons, on different queries, and sometimes flag different brands on the same prompt. A brand's reputation in Google AI Overviews may look completely different from its reputation in ChatGPT. Monitoring one engine is not sufficient.
Your Industry Determines Your Risk Profile. Electronics and Education face more Google-driven negativity (controversy and news). Apparel faces more ChatGPT-driven negativity (product evaluation). The triggers, the engine, and the severity all depend on the vertical. Cross-industry benchmarks obscure more than they reveal.
The Research Phase Is Where It Matters Most. 85% of Google's negative sentiment and 68.5% of ChatGPT's appears during the informational stage. This is when opinions form. Brands that only monitor their AI presence at the transactional level are missing where the conversation is actually happening.
Sentiment Monitoring Is the Next Layer of AI Optimization. Knowing where you're cited is essential. Knowing how you're described is what comes next. As AI engines take on a larger role in shaping brand perception, sentiment tracking across engines becomes as important as citation tracking.
Technical Methodology
| Parameter | Detail |
| Data Source | BrightEdge AI Catalyst™ |
| Engines Analyzed | Google AI Overviews, ChatGPT |
| Sentiment Classification | Brand-level sentiment (positive, neutral, negative) for every brand mentioned, plus primary sentiment for overall response tone |
| Intent Classification | Informational, Consideration, Transactional, Post Purchase, Branded Intent, Not Applicable |
| Industries Covered | Apparel, Electronics, Education |
| Cross-Engine Analysis | Overlapping prompts appearing in both engines compared for sentiment alignment and brand-level agreement |
Key Takeaways
| Finding | Detail |
| Negative Sentiment Is Present but Small | Google AI Overviews: 2.3% negative. ChatGPT: 1.6%. The vast majority of AI brand mentions are positive or neutral. |
| Different Editorial Instincts | Google skews toward controversy (4.5x more likely). ChatGPT skews toward product evaluation (3x more likely). Same brand, different risks on each engine. |
| Industry Changes Everything | Electronics and Education: Google more negative. Apparel: ChatGPT 3x more negative. No single benchmark applies across verticals. |
| Informational Queries Are the Battleground | 85% of Google's negative sentiment and 68.5% of ChatGPT's appears during the research phase — before purchase decisions are made. |
| The Engines Frequently Disagree | On overlapping negative prompts, Google and ChatGPT flagged different brands 73% of the time. One engine is not enough. |
| AI Is Becoming a Brand Evaluator | ~1.4% of prompts show mixed sentiment — AI praising some brands while criticizing others in the same response. New territory for search. |
Download the Full Report
Download the full AI Search Report — When AI Goes Negative: How Google AI Overviews and ChatGPT Handle Brand Criticism Differently
Click the button above to download the full report in PDF format.
Published on February 19, 2026
When AI Goes Negative: How Google AI Overviews and ChatGPT Handle Brand Criticism Differently
AI Overviews at the One-Year Mark: Presence, Size, and What They’re Citing
BrightEdge data reveals AI Overviews now trigger on nearly half of all tracked queries — but organic still controls the majority of search. The real story is in how AIOs are growing, what they’re citing, and how dramatically that varies by industry.
BrightEdge data reveals AI Overviews now trigger on nearly half of all tracked queries — but organic still controls the majority of search. The real story is in how AIOs are growing, what they’re citing, and how dramatically that varies by industry.
It’s been a massive year of change in search, and AI Overviews are playing a bigger role than ever. Many marketers are noticing the impact — shifts in click-through rates, changes in traffic patterns, new questions about what’s actually driving visibility.
So we used BrightEdge’s Generative Parser to take a deep look at how AIOs have evolved over the past 12 months. We tracked AIO presence across our keyword set, measured the actual pixel height of AIOs on the page, and analyzed citation overlap — whether the sources Google cites in AIOs are the same ones ranking on page 1 organically.
We then compared citation overlap snapshots a year apart, broken out by industry, to understand how the relationship between organic rankings and AIO citations is evolving across verticals.
Data Collected
Using BrightEdge AI Catalyst™ and our Generative Parser, we analyzed:
- AIO presence: the percentage of tracked keywords triggering an AI Overview, daily over 12 months
- AIO pixel height: the average height of AIOs in pixels, tracked daily over 12 months
- Citation-to-organic overlap: the percentage of AIO-cited sources that also rank in the organic top 10, tracked over a five-month window
- Industry citation overlap: year-over-year snapshots comparing AIO citation overlap with organic rankings across nine verticals
Key Finding
AI Overviews are growing fast — but organic still runs the majority of search. And what Google cites in AIOs is largely different from what ranks on page 1.
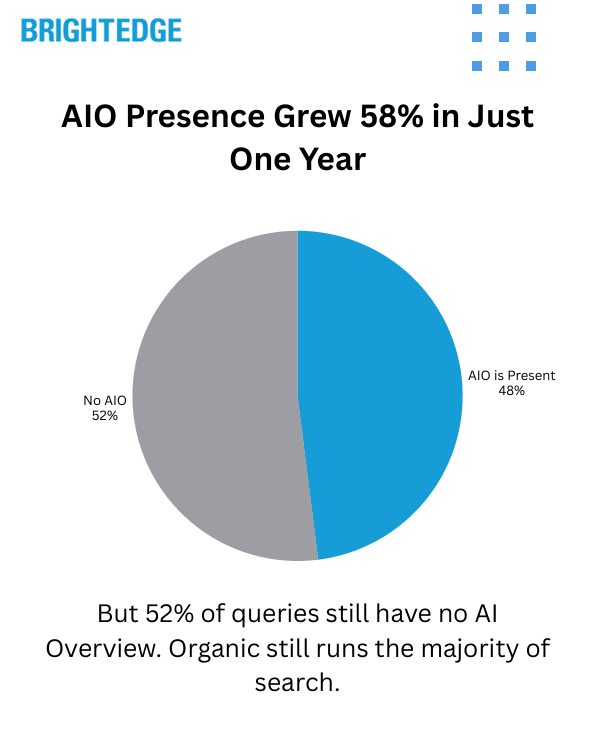
AIO presence has grown from roughly 30% to 48% of tracked queries over the past year — a 58% increase. When AIOs appear, they now average over 1,200 pixels tall, pushing organic results completely below the fold on a standard screen.
But the other side of that number matters just as much: approximately 52% of queries still trigger no AI Overview at all. For the majority of search, organic rankings remain the entire experience.
The citation overlap data adds another layer. Only about 17% of sources cited in AIOs also rank in the organic top 10 — and that number has been flat for months. Roughly 5 out of 6 AIO citations pull from content that isn’t on page 1 of traditional results. This varies dramatically by industry, from 24% overlap in Healthcare to just 11% in Finance.
AIO Presence: From 30% to Nearly Half of All Queries
Over the past 12 months, AIO presence has grown steadily and significantly:
| Time Period | Avg AIO Presence |
| Feb 2025 | ~31% |
| Mar 2025 | ~33% |
| Apr 2025 | ~33% |
| May 2025 | ~37% |
| Jun 2025 | ~42% |
| Jul 2025 | ~44% |
| Aug 2025 | ~47% |
| Sep 2025 | ~46% |
| Oct 2025 | ~44% |
| Nov 2025 | ~45% |
| Dec 2025 | ~46% |
| Jan 2026 | ~47% |
| Feb 2026 | ~48% |
The growth trend has been consistent, with AIO presence crossing the 40% mark in mid-2025 and pushing toward 50% by early 2026. At peak, AIOs appeared on more than half of all tracked queries.
But flip that number around: approximately 52% of queries still have no AI Overview at all. For the majority of search, organic rankings are still the entire experience. That’s not a footnote — it’s the foundation everything else builds on.
AIO Pixel Height: Pushing Organic Below the Fold
When AIOs do appear, they’re taking up more of the screen than ever. We tracked the average pixel height of AIOs daily over the past year:
| Metric | Value |
| Starting avg height (Feb 2025) | ~1,050 pixels |
| Current avg height (Feb 2026) | ~1,200 pixels |
| Year-over-year growth | ~15% |
| Peak monthly average | ~1,340 pixels (Dec 2025) |
| Standard desktop viewport | ~900 pixels |
On a standard desktop viewport of approximately 900 pixels, the average AIO now consumes more than the entire visible screen before a user scrolls. The first organic result sits completely below the fold. Users are getting answers — or at least a substantial response — before they ever see a traditional blue link.
This has direct implications for click-through rates. Even when organic results are strong, the sheer physical space AIOs now occupy means fewer users are making it to the organic listings when an AIO is present.
Citation Overlap: What AIOs Cite vs. What Ranks on Page 1
This is where the data gets especially interesting. We analyzed whether the sources Google cites within AI Overviews are the same sources that rank in the organic top 10 for those queries.
| Month | Top-10 Overlap | % Ranking Somewhere in Top 100 |
| Feb 2025 | ~16.4% | ~48.7% |
| Mar 2025 | ~16.1% | ~49.7% |
| Apr 2025 | ~16.9% | ~50.8% |
| May 2025 | ~16.1% | ~51.0% |
| Jun 2025 | ~16.8% | ~52.8% |
| Jul 2025 | ~16.6% | ~53.1% |
Only about 17% of sources cited in AIOs also rank in the organic top 10. That number has been remarkably flat — barely moving over the entire tracking period. Roughly 5 out of 6 AIO citations are pulling from content that isn’t on page 1 of traditional search results.
What does this mean practically? Ranking #1 organically doesn’t automatically get you cited in the AIO. And not ranking on page 1 doesn’t mean you’re excluded from AIO citations either. The two experiences are connected — but they’re not the same thing.
The broader overlap (sources ranking somewhere in the top 100) has been slowly increasing, from about 49% to 53%. Google is gradually pulling more AIO citations from content that ranks organically — but the page-1 overlap has stayed flat. The growth is coming from content ranking on pages 2 through 10, which users would essentially never reach through traditional organic browsing.
Industry Breakdown: AIO Citation Overlap Varies Dramatically
We compared AIO citation overlap with organic top-10 rankings across nine industries, using snapshots taken a year apart. The differences are striking:
| Industry | Top-10 Overlap (Last Year) | Top-10 Overlap (Today) | Change |
| Healthcare | 23.9% | 24.0% | +0.1pp |
| B2B Tech | 23.9% | 22.6% | -1.3pp |
| Education | 26.9% | 23.1% | -3.8pp |
| Insurance | 22.7% | 22.4% | -0.3pp |
| Entertainment | 3.2% | 18.5% | +15.2pp |
| Travel | 5.7% | 17.7% | +12.0pp |
| eCommerce | 2.9% | 13.4% | +10.5pp |
| Finance | 7.6% | 11.3% | +3.7pp |
| Restaurants | 5.1% | 9.3% | +4.2pp |
Healthcare: The Highest Overlap
Healthcare has the highest top-10 overlap at approximately 24%, and it’s been stable year over year. Google appears to lean heavily on already-trusted, already-ranking sources when generating health-related AIOs — consistent with its YMYL (Your Money or Your Life) approach to sensitive content. If you rank well organically in Healthcare, you’re more likely to be cited in the AIO than in any other vertical.
B2B Tech, Education, and Insurance: Stable Middle Ground
These verticals sit in the low 20s for top-10 overlap and have been relatively stable. About one in four to five AIO citations comes from a page-1 organic result. The majority of citations still come from outside the top 10, but there’s a meaningful connection between organic authority and AIO visibility in these spaces.
Travel, eCommerce, and Entertainment: Massive Year-Over-Year Growth
These verticals saw the most dramatic shifts. Travel’s top-10 overlap jumped from 6% to 18%. eCommerce went from 3% to 13%. Entertainment surged from 3% to 19%. A year ago, AIOs in these verticals were citing almost entirely from outside the organic top 10. That’s changing fast — but even with these gains, the vast majority of AIO citations in these spaces (80%+) still come from outside page 1.
Finance: Low Overlap, High Divergence
Finance has just 11% top-10 overlap — meaning nearly 9 out of 10 AIO citations come from sources outside the organic top 10. This is one of the most divergent verticals, where what Google cites in AIOs looks very different from what ranks on page 1 organically. For finance brands, organic rankings and AIO visibility may require attention to different content signals.
The Non-Ranking Story: How Much Are AIOs Citing Sources Outside the Top 100?
Beyond the top-10 overlap, we also looked at how many AIO citations come from sources that don’t rank anywhere in the top 100 organic results. The year-over-year trend shows AIOs becoming somewhat more aligned with organic rankings overall — but the gap remains large in many verticals:
| Industry | % Not in Top 100 (Last Year) | % Not in Top 100 (Today) | Change |
| Healthcare | 26.4% | 22.5% | -3.8pp |
| B2B Tech | 35.2% | 28.1% | -7.1pp |
| Insurance | 39.0% | 28.3% | -10.8pp |
| Education | 31.1% | 28.2% | -2.8pp |
| Entertainment | 92.2% | 46.6% | -45.6pp |
| Travel | 85.9% | 47.8% | -38.1pp |
| eCommerce | 92.9% | 61.5% | -31.3pp |
| Finance | 82.0% | 65.7% | -16.3pp |
| Restaurants | 88.3% | 76.0% | -12.3pp |
The overall trend is clear: AIOs are becoming more connected to organically-ranking content across the board. But in verticals like Finance (66%), eCommerce (62%), and Restaurants (76%), the majority of AIO citations still come from sources that don’t rank anywhere in the top 100 organic results. These are fundamentally different content sets.
What This Means for Your Search Strategy
- Organic Still Runs the Majority of Search
With approximately 52% of queries triggering no AI Overview at all, organic rankings remain the primary visibility channel for most search activity. The fundamentals — content quality, technical health, topical authority — are the foundation everything builds on.
- When AIOs Appear, They Dominate the Screen
An average AIO now exceeds 1,200 pixels — taller than a standard visible screen. The first organic result sits below the fold. For queries where AIOs are present, click-through rates to organic results are under pressure regardless of ranking position.
- Page-1 Rankings and AIO Citations Are Connected — But Not the Same
Only about 17% of AIO citations come from the organic top 10. Ranking #1 doesn’t guarantee AIO inclusion, and not ranking on page 1 doesn’t mean exclusion. Understanding your visibility across both organic and AIO experiences is essential.
- Your Industry Changes Everything
Healthcare sees 24% top-10 overlap. Finance sees 11%. The relationship between organic rankings and AIO citations is not universal — it’s vertical-specific. Brands need to understand how AIOs behave in their specific industry to make informed decisions.
- The Direction Is Toward More Alignment — But We’re Not There Yet
AIOs are gradually citing more content that also ranks organically, particularly in verticals like Travel, eCommerce, and Entertainment where overlap has grown significantly year over year. But even in the fastest-growing categories, 80%+ of AIO citations still come from outside the organic top 10. The gap is closing, but it’s still wide.
Technical Methodology
Data Source: BrightEdge AI Catalyst™, Generative Parser
Analysis Period: February 2025 – February 2026 (12-month tracking)
AIO Presence: Daily tracking of AI Overview triggering rates across tracked keyword set
AIO Pixel Height: Daily measurement of average AI Overview height in pixels
Citation Overlap: Weekly analysis of overlap between AIO-cited sources and organic ranking positions (top 10, top 100)
Industry Snapshots: Year-over-year comparison of citation overlap across nine verticals
Industries Covered: Healthcare, B2B Tech, Education, Insurance, Entertainment, Travel, eCommerce, Finance, Restaurants
Key Takeaways
- AIO Presence Has Grown Significantly: AI Overviews now trigger on approximately 48% of tracked queries, up from 30% a year ago — a 58% increase. At peak, more than half of all queries showed an AIO.
- But Organic Still Dominates: Approximately 52% of queries have no AI Overview. For the majority of search, traditional organic rankings are the entire user experience.
- AIOs Are Pushing Organic Below the Fold: Average AIO height now exceeds 1,200 pixels, up 15% year over year. On a standard screen, the first organic result sits below the fold when an AIO is present.
- AIO Citations and Page-1 Rankings Are Largely Different: Only about 17% of AIO-cited sources also rank in the organic top 10. This has been flat for months. The content AIOs cite is largely different from what users see on page 1.
- Industry Differences Are Dramatic: Healthcare sees 24% top-10 overlap. Finance sees just 11%. Travel grew from 6% to 18% year over year. Every vertical has a different relationship with AIOs.
- The Trend Is Toward More Alignment: AIOs are gradually citing more organically-ranking content, particularly in Travel, eCommerce, and Entertainment. But even in the fastest-moving verticals, 80%+ of citations still come from outside the top 10.
Download the Full Report
Download the full AI Search Report — AI Overviews at the One-Year Mark: Presence, Size, and What They’re Citing
Click the button above to download the full report in PDF format.
Published on February 12, 2026
AI Overviews at the One-Year Mark: Presence, Size, and What They’re Citing
AI Search Citations: How Much Do They Really Change Week to Week?
BrightEdge data reveals AI engines are consolidating — not redistributing — citations. The core is remarkably stable. But when changes happen, they're sudden, binary, and overwhelmingly downward.
We track thousands of prompts across ChatGPT, Gemini, Google AI Mode, Google AI Overviews, and Perplexity every week, spanning nine industries. This week we asked a fundamental question: how volatile are AI search citations really? Are the sources AI engines cite and mention changing constantly — or are they more stable than people think?
The answer is encouraging — with an important caveat.
Data Collected
Using BrightEdge AI Catalyst™, we analyzed citation and mention behavior across all five major AI engines to understand::
- How many domains saw week-over-week changes in citation share
- Whether changes skewed toward gains or losses
- How volatility correlates with citation volume and industry
- Whether brand mentions and citations are moving in the same direction
- The relationship between mention rank position and stability
Key Finding
AI search is consolidating, not redistributing. The vast majority of citations are stable week to week — but when changes happen, they're overwhelmingly losses.
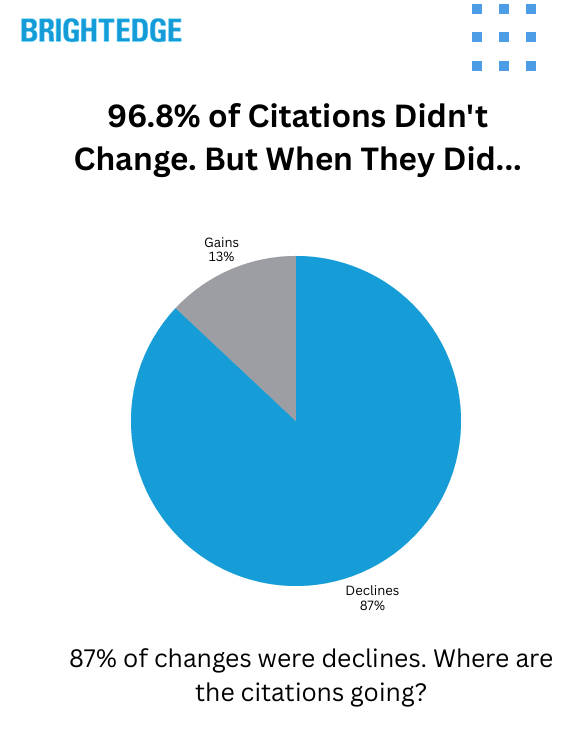
96.8% of cited domains saw zero change week over week. Among the roughly 3% that did move, 87% were declines. Only 13% were gains. And those changes weren't gradual — most were binary, with domains going from cited to not cited at all on a given prompt.
Over 51% of all citation volume was associated with declining domains. Only about 5% was associated with growing ones. The losses aren't being redistributed to new winners. They're disappearing. AI engines are tightening their citation radius — getting more selective about what they link to, not swapping one source for another.
The Stability Story: How Locked In Is the Core?
The headline numbers paint a clear picture of stability:
| Metric | This Week |
| Citations — % of domains with zero change | 96.8% |
| Mentions — % of brands with zero change | 97.2% |
| Top-ranked brands (#1 or #2 position) — % with zero change | 99.4% |
If a domain is part of the trusted citation set for a given prompt, it tends to stay there. And the higher you rank, the more durable your position. Brands in the #1 or #2 mention position are nearly cemented — only 0.6% saw any movement.
That stability drops as you move down the rankings:
| Mention Rank Position | % That Changed | Avg Change |
| Top ranked (1–2) | 0.6% | 0.6% |
| Mid ranked (2–4) | 4.1% | 3.1% |
| Lower ranked (5+) | 3.0% | 2.3% |
The core holds. The volatility lives in the middle and tail positions.
But When Things Change, They Go Down — Fast
Among the ~3% of domains that did see citation changes this week, the direction was overwhelmingly one-sided:
| Direction | % of Changes | Share of Citation Volume |
| Declining | 87% | 51.3% |
| Growing | 13% | 5.3% |
| No change | — | 43.5% |
Most changes were binary. Domains didn't gradually lose a few percentage points of citation share — they went from being cited to not being cited at all on a given prompt. Only about 0.4% of all tracked domains gained new citations this week.
This means the losses aren't flowing to new winners. AI engines are pruning their citation sets without proportional replacement. The citation radius is tightening.
The Core vs. Fringe Dynamic: Why Bigger Footprints See More Churn
At first glance, the data seems counterintuitive: domains with larger citation footprints are more likely to see week-over-week changes. But this makes perfect sense once you understand the two-zone dynamic.
Think of any domain's citation footprint as two zones:
- The core — prompts where it's consistently the best source. Rock solid.
- The fringe — prompts where it's borderline relevant, maybe the 8th or 9th best answer. This is where the churn happens.
A domain cited on just a handful of highly specific prompts is almost certainly there because it's genuinely the best source — there's no fringe zone. A domain cited across thousands of prompts inevitably has a margin of borderline inclusions that can rotate in or out weekly.
The data confirms this:
| Domain Tier | % That Changed | Typical Fringe Size |
| Highest-volume domains (top 50) | 90% | ~5% of citation share |
| Domains with 100+ citations | 65.2% | ~17% of citation share |
| Top 10% by volume | 21.1% | Larger shifts |
| Bottom 50% by volume | 0.4% | Minimal |
Among the very biggest domains, 90% have a fringe — but it's typically only about 5% of their total citation share that's in play any given week. For mid-tier domains with solid footprints, that fringe widens to around 17%.
The core holds. It's the edges that get trimmed.
Citation Concentration: The Rich Get Richer
AI search citations are heavily concentrated among a small number of domains:
| Domain Percentile | Share of All Citations |
| Top 1% | 64% |
| Top 5% | 78% |
| Top 10% | 84% |
Mentions are slightly less concentrated but still steep:
| Brand Percentile | Share of All Mentions |
| Top 1% | 44.5% |
| Top 5% | 62.3% |
| Top 10% | 69.6% |
This concentration, combined with the pruning trend, means the barrier to entry is high and rising. Only 0.4% of domains gained new citations this week. The door in is narrow.
Not All Industries Churn Equally
Citation volatility varies significantly by industry vertical and website type.
Citation Volatility by Website Type
| Website Type | % of Domains That Changed | % of Changes That Were Declines |
| Finance | 51.1% | 91% |
| Review Sites | 45.5% | 100% |
| News/Media | 44.8% | 92% |
| Reference/Encyclopedia | 38.5% | 80% |
| Health/Medical | 34.2% | 100% |
| Video Platforms | 33.3% | 100% |
| eCommerce/Retail | 23.1% | 73% |
| Tech | 15.2% | 91% |
| Government/Institutional | 3.6% | 77% |
Finance sites are the most volatile — over half of tracked finance domains saw citation changes, with 91% of those being declines. Financial data sites, market trackers, and investment research platforms are experiencing the most pruning.
Review sites and news/media follow closely, both skewing heavily negative. Health/medical sites are notable: while "only" 34% changed, 100% of those changes were declines.
eCommerce/retail was the most balanced category, with the highest proportion of positive changes (27% of changes were gains). Government and institutional sites were the most stable at under 4% — when AI engines trust a .gov source, that trust holds.
The Emerging Split: Being Mentioned ≠ Being Cited
One of the most striking patterns this week was the divergence between mentions and citations. Multiple website categories saw their citations drop significantly while their mentions actually increased.
| Website Type | Citation Trend | Mention Trend |
| Social platforms | Large declines (-34% to -45%) | Gains (+11% to +18%) |
| Financial data/analysis sites | Steep declines (-35% to -57%) | Gains (+20% to +65%) |
| Reference/dictionary sites | Declines (-33% to -40%) | Gains (+27% to +67%) |
| Video platforms | Significant decline | Gains (+18%) |
| Review/editorial sites | Declines (-33% to -50%) | Gains (+20% to +25%) |
AI engines are still talking about these sources by name — referencing them in the body of their answers — but increasingly choosing not to link to them.
This suggests that brand authority and citation authority are becoming two different things in AI search. You can be well-known to the models without earning the link. Being mentioned is not the same as being cited — and the gap is growing.
Prompt Landscape: What AI Engines Are Being Asked
While the prompt data doesn't allow week-over-week comparison, it reveals important structural patterns about how AI search works across industries.
Intent Distribution by Industry
| Industry | Consideration | Informational | Transactional |
| eCommerce | 61.5% | 23.1% | 15.2% |
| Travel | 39.5% | 56.6% | 3.9% |
| Finance | 28.1% | 31.4% | 39.9% |
| Restaurants | 27.9% | 33.4% | 38.7% |
| Insurance | 26.5% | 65.8% | 7.7% |
| Education | 22.3% | 75.4% | 2.2% |
| B2B Tech | 14.2% | 76.5% | 8.9% |
| Entertainment | 7.3% | 83.4% | 9.4% |
| Healthcare | 4.3% | 94.2% | 1.5% |
Healthcare is overwhelmingly informational (94.2%) — people are researching symptoms and conditions. eCommerce is majority consideration (61.5%) — people are shopping and comparing. Finance is the most evenly split across all three intents.
Competitive Density by Industry
| Industry | Avg Brands Mentioned Per Prompt | Avg URLs Cited Per Prompt |
| Travel | 26.2 | 24.7 |
| Education | 17.0 | 24.8 |
| Restaurants | 16.4 | 15.9 |
| eCommerce | 16.0 | 16.8 |
| B2B Tech | 14.8 | 20.2 |
| Insurance | 13.4 | 20.4 |
| Finance | 11.4 | 15.1 |
| Healthcare | 11.1 | 21.2 |
| Entertainment | 10.9 | 12.5 |
Travel is the most crowded vertical — an average of 26.2 brands mentioned per prompt and 24.7 URLs cited. If you're competing in travel, the AI answer landscape is significantly more congested than any other industry.
Healthcare shows a unique pattern: relatively few brands per prompt (11.1) but a high URL citation count (21.2). AI engines cite lots of medical sources — medical centers, government health agencies, research databases — but mention fewer commercial brands.
How Citations and Mentions Differ by Intent
| Intent Type | Avg Mentions Per Prompt | Avg Citations Per Prompt |
| Informational | 19.1 | 35.2 |
| Consideration | 27.4 | 29.2 |
| Transactional | 19.0 | 24.6 |
Informational prompts generate nearly twice as many citations as mentions — AI engines are linking to more sources when explaining concepts. Consideration prompts bring mentions closer to citations — brands get named when users are comparing options. Transactional prompts generate the fewest citations — AI engines are more direct when users are ready to act.
What This Means for Your AI Search Strategy
1. If You're in the Core, You're in a Strong Position
97% of citations didn't change this week. Positions at the top of the mention rankings are especially durable — 99.4% of #1 and #2 positions held. If you've built strong AI search presence, that investment is paying off with real stability.
2. But Changes Are Binary — Monitor Before They Happen
Domains don't slowly lose citation share over weeks. They go from cited to not cited in a single cycle. There's no gradual warning. Understanding where you sit — core vs. fringe — on each prompt is how you stay ahead of shifts rather than reacting to them.
3. AI Engines Are Getting More Selective, Not Shifting Preferences
The pruning trend means AI engines are tightening around fewer trusted sources. Losses aren't flowing to competitors. This makes existing positions more valuable — and makes breaking in harder for newcomers. Only 0.4% of domains gained new citations this week.
4. Brand Awareness Isn't Enough — You Need Citation Authority
The growing gap between mentions and citations means being known to AI engines doesn't automatically earn you the link. Optimizing for citation visibility — not just brand mentions — is increasingly important as the two diverge.
5. Know Your Industry's Volatility Profile
Finance and news/media domains face significantly more churn than eCommerce or government sites. If you're in a high-volatility category, monitoring your fringe positions is especially critical — that's where the pruning is happening fastest.
Technical Methodology
Data Source: BrightEdge AI Catalyst™
Analysis Period: Week of February 1, 2026 (week-over-week comparison)
AI Engines Tracked: ChatGPT, Gemini, Google AI Mode, Google AI Overviews, Perplexity
Industries Covered: eCommerce, Healthcare, Finance, Travel, B2B Tech, Entertainment, Education, Restaurants, Insurance
Metrics Analyzed:
- Citation share of voice and week-over-week change by domain
- Mention share and week-over-week change by brand
- Brand average mention rank position
- Prompt intent classification (Informational, Consideration, Transactional)
- Brand and URL density per prompt by industry
Website Type Classification: Domains categorized by type (Finance, Health/Medical, eCommerce/Retail, News/Media, Tech, Government/Institutional, Social/UGC, Video, Review Sites, Reference/Encyclopedia, Travel, Entertainment) based on domain characteristics.
Key Takeaways
AI Search Citations Are Remarkably Stable: 96.8% of cited domains and 97.2% of mentioned brands saw zero change week over week. Top-ranked positions (#1 and #2) are nearly locked in at 99.4% stability.
But When Changes Happen, They're Overwhelmingly Losses: 87% of citation changes were declines. Over 51% of citation volume was associated with declining domains, vs. only 5% with growing ones. Changes are binary — domains drop out entirely rather than fading gradually.
AI Is Consolidating, Not Redistributing: Losses aren't flowing to new winners. AI engines are pruning borderline citations without replacement, tightening around a smaller set of trusted sources. Only 0.4% of domains gained new citations.
Bigger Footprints Have Bigger Fringes: The highest-volume domains are most likely to see changes, but those changes typically affect only ~5% of their citation share. Mid-tier domains see wider fringe exposure (~17%). The core is stable; it's the edges that churn.
Finance Is the Most Volatile Category: 51% of finance domains saw citation changes (91% declines). Review sites, news/media, and health/medical follow. Government sites are the most stable at under 4%.
Brand Mentions and Citations Are Diverging: Multiple categories saw citations decline while mentions increased. AI engines are naming brands without linking to them. Brand authority and citation authority are becoming two separate things.
18 Months of AI Overviews: What Healthcare Tells Us About Where Finance Is Headed
BrightEdge data reveals Google uses the same YMYL playbook for both industries. The difference isn't how Google treats them — it's how people search.
Download the Full Report
Download the full AI Search Report — AI Search Citations: How Much Do They Really Change Week to Week?
Click the button above to download the full report in PDF format.
Published on February 6, 2026
AI Search Citations: How Much Do They Really Change Week to Week?
18 Months of AI Overviews: What Healthcare Tells Us About Where Finance Is Headed
BrightEdge data reveals Google uses the same YMYL playbook for both industries. The difference isn't how Google treats them — it's how people search.
It's been 18 months since Google launched AI Overviews. We now have enough data to see patterns — and make predictions.
On the surface, Healthcare and Finance look completely different. Healthcare sits at 88% AI Overview coverage. Finance is at 21%. But 18 months of BrightEdge Generative Parser™ data reveals something deeper: Google applies the same logic to both categories. The gap isn't about how Google treats YMYL content — it's about how people search in these industries.
Data Collected
Using BrightEdge Generative Parser™, we analyzed AI Overview presence across Healthcare and Finance from May 2024 through December 2025 to understand:
- How AI Overview coverage evolved in each industry over 18 months
- Which query types saw the fastest expansion
- Where Google kept AI out — and why
- Whether the two YMYL categories follow the same underlying pattern
Key Finding
Google uses the same playbook for both industries. Finance just has a different query mix.
A large portion of Finance search is real-time queries — stock prices, tickers, market data. Healthcare doesn't have an equivalent. Google keeps AI out of real-time data for good reason: you need accuracy, not synthesis.
But when you compare similar query types — the educational, explainer, "help me understand" searches — the trajectory is nearly identical:
- Healthcare educational: 82% → 93% (near saturation)
- Finance educational: 16% → 67% (climbing fast)
Finance educational content is where Healthcare was 12-18 months ago. At current growth rates, Finance will reach Healthcare-level saturation (90%+) by late 2026.
The Headline Gap: Why Finance Looks So Different
At first glance, the numbers tell a simple story:
| Industry | May 2024 | December 2025 | Change |
| Healthcare | 72% | 88% | +16pp |
| Finance | 6% | 21% | +15pp |
Both industries grew roughly the same amount in absolute terms. But Healthcare started high; Finance started low.
The reason isn't Google's caution with financial content. It's the query mix.
Finance Query Composition
Finance search includes a massive real-time component that Healthcare simply doesn't have:
| Query Type | Example Keywords | % of Finance Queries | AIO Rate (Dec '25) |
| Stock Tickers | "AAPL stock price," "NASDAQ," "SPY" | ~70% | 8% |
| Educational | "what is a Roth IRA," "how do bonds work" | ~13% | 67% |
| Trading | "premarket futures," "stock market today" | ~4% | 44% |
| Tools/Calculators | "mortgage calculator," "401k calculator" | ~3% | 11% |
When someone searches "AAPL stock price," they don't need AI synthesis. They need a live price chart. Google's traditional SERP features — the stock widget, the market summary — already do this job perfectly.
Healthcare doesn't have an equivalent category. There's no "diabetes ticker" that needs real-time data. The vast majority of Healthcare searches are educational — symptoms, conditions, treatments — where AI synthesis adds genuine value.
The Parallel: Educational Queries Tell the Real Story
When you isolate educational queries in both industries, the pattern becomes clear:
Healthcare Educational (Specialty Care: Conditions, Symptoms, Treatments)
| Period | AIO Rate |
| May 2024 | 82% |
| September 2024 | 75% |
| December 2024 | 91% |
| May 2025 | 92% |
| September 2025 | 90% |
| December 2025 | 93% |
Healthcare launched high and reached near-saturation within 18 months.
Finance Educational (Tax, Retirement, Planning, Credit)
| Period | AIO Rate |
| May 2024 | 16% |
| September 2024 | 24% |
| December 2024 | 27% |
| May 2025 | 37% |
| September 2025 | 66% |
| December 2025 | 67% |
Finance educational started low but grew 51 percentage points in 18 months — accelerating sharply in 2025.
What This Means
The gap between Healthcare (93%) and Finance (67%) educational queries is now just 26 percentage points — down from 66 points in May 2024.
At Finance's current growth rate, educational content will reach 90%+ saturation by late 2026.
Where Google Expanded in Finance
The growth wasn't uniform. Some Finance categories exploded while others barely moved.
Biggest Movers (May 2024 → December 2025)
| Category | Example Keywords | May '24 | Dec '25 | Growth |
| Tax Planning | "tax brackets," "capital gains tax," "tax refund" | 0% | 63% | +63pp |
| Cash Management | "high yield savings account," "money market" | 13% | 79% | +67pp |
| Financial Planning | "mortgage rates," "CD rates," "compound interest" | 6% | 73% | +67pp |
| Credit & Debt | "student loan forgiveness," "how much house can I afford" | 5% | 62% | +57pp |
| Fixed Income | "treasury bills," "bond rates," "annuity" | 12% | 72% | +60pp |
| Retirement | "Roth IRA," "401k," "social security" | 33% | 61% | +28pp |
What Stayed Flat
| Category | Example Keywords | May '24 | Dec '25 | Growth |
| Stock Tickers | "AAPL stock," "SPY," "TSLA price" | 4% | 8% | +4pp |
| Brand/Navigational | "Fidelity," "Charles Schwab," "Vanguard" | 2% | 14% | +12pp |
The Pattern
Google went all-in on the same query types in Finance that it dominated in Healthcare: educational, explainer, planning content. The categories that grew fastest are the ones where AI synthesis genuinely helps users understand complex topics.
Meanwhile, Google kept AI out of real-time data and navigational queries — the same approach it takes in every industry.
Where Google Kept AI Out — In Both Industries
The most revealing pattern isn't where Google expanded. It's where Google deliberately kept AI out — and how consistent that logic is across both YMYL categories.
Local "Near Me" Queries
| Industry | Query Type | May '24 | Dec '25 |
| Healthcare | "doctor near me," "urgent care near me" | 0% | 11% |
| Finance | "bank near me," "financial advisor near me" | 0% | 20% |
Google tested AI Overviews on local queries in both industries — then pulled back. These queries belong to maps and local pack, not AI synthesis.
Real-Time Data
| Industry | Query Type | AIO Rate (Dec '25) |
| Finance | Stock tickers, market prices | 8% |
| Healthcare | N/A (no equivalent) | — |
Finance has a massive category of queries where real-time accuracy matters more than synthesis. Healthcare doesn't have an equivalent — which is why Healthcare's overall number is so much higher.
The Logic
Google applies the same framework everywhere:
- AI where synthesis adds value: Educational content, explainers, planning queries
- Traditional results where accuracy matters: Real-time data, local queries, navigational searches
The 18-Month Trajectory: Side by Side
Healthcare
| Period | Conditions/Symptoms | General Education | Local |
| May 2024 | 82% | 50% | 0% |
| September 2024 | 75% | 48% | 0% |
| December 2024 | 91% | 64% | 4% |
| May 2025 | 92% | 71% | 14% |
| September 2025 | 90% | 70% | 7% |
| December 2025 | 93% | 74% | 11% |
Finance
| Period | Educational | Real-Time (Tickers) | Local |
| May 2024 | 16% | 4% | 0% |
| September 2024 | 24% | 3% | 0% |
| December 2024 | 27% | 4% | 0% |
| May 2025 | 37% | 4% | 0% |
| September 2025 | 66% | 6% | 0% |
| December 2025 | 67% | 8% | 20% |
What This Means
The trajectories follow the same pattern:
- Educational content saturates first — Healthcare conditions hit 90%+ by December 2024; Finance educational is on the same path
- Local queries get tested, then pulled back — Both industries saw Google experiment with AI on "near me" queries, then reduce coverage
- Real-time/transactional stays flat — Stock tickers in Finance, navigational queries in both industries
Why This Matters: The Prediction
Based on 18 months of data across both YMYL categories, here's what we expect:
Finance Educational Content Will Hit 90%+ by Late 2026
Finance educational queries grew 51 percentage points in 18 months (16% → 67%). At this rate, saturation matching Healthcare (90%+) is 12-18 months away.
The Headline Gap Will Close
As Finance educational content saturates, the overall Finance AI Overview rate will climb toward Healthcare's level. The 67-point gap (21% vs 88%) will narrow significantly — not because Google is changing its approach, but because the query mix effect will diminish as more categories reach saturation.
Local Will Stay Local
Google tested AI Overviews on "near me" queries in both industries and pulled back. This is Maps territory. Don't expect AI to take over local search in YMYL categories.
Real-Time Will Stay Traditional
Stock tickers, market data, and live prices will remain in traditional SERP features. Google won't risk AI synthesis where accuracy matters most.
What This Means for Financial Services Marketers
1. Educational Content Is AI Territory — Optimize Now
Tax explainers, retirement planning guides, mortgage education, credit fundamentals — these query types are already at 60-70% AI Overview coverage and climbing. If you're not optimizing for AI visibility on educational content, you're ceding ground.
2. The Playbook Is Clear: Healthcare Shows the Way
Healthcare's trajectory is Finance's future. The categories that saturated first in Healthcare (conditions, symptoms, treatments) are analogous to what's saturating now in Finance (tax, retirement, planning). Look at where Healthcare is today to see where Finance will be in 12-18 months.
3. Real-Time and Local Are Different Games
If your strategy is focused on stock-related queries or local branch visibility, traditional SEO still applies. AI Overviews aren't taking over these spaces — Google is deliberately keeping them in specialized SERP features.
4. Track Query Intent, Not Just Industry Averages
The headline number (21% for Finance) is misleading. Educational Finance queries are already at 67%. Knowing which of YOUR queries fall into which category — and how AI Overview coverage is changing for each — is essential for strategy.
Technical Methodology
Data Source: BrightEdge Generative Parser™
Analysis Period: May 2024 through December 2025 (6 measurement points: May '24, September '24, December '24, May '25, September '25, December '25)
Sample Size:
- Finance: 2,580 keywords tracked consistently across all periods
- Healthcare: 2,760 keywords tracked consistently across all periods
Categorization:
- Finance queries categorized by L1/L2 taxonomy: Stocks & Trading, Finance & Investing (subdivided into Tax Planning, Retirement, Financial Planning, etc.), Tools, Brands
- Healthcare queries categorized by L1/L2 taxonomy: Specialty Care (Ortho, Neuro, Gastro, etc.), General Health, Primary Care
AI Overview Detection: Keywords classified as having AI Overview if Sge State ≠ "none"
Local Query Identification: Keywords containing "near me" flagged as local intent
Key Takeaways
Google Uses the Same YMYL Playbook for Healthcare and Finance: AI where synthesis adds value (educational content). Traditional results where accuracy matters (real-time data, local queries). The logic is identical across both industries.
The Gap Is About Query Mix, Not Google's Approach: Finance has a large real-time component (stock tickers) that Healthcare doesn't. Remove that from the equation, and the trajectories are nearly parallel.
Finance Educational Content Is Climbing Fast: 16% → 67% in 18 months. The acceleration in 2025 (37% → 67% in just 7 months) suggests Google has gained confidence in AI for financial education content.
Prediction: Finance Hits Healthcare Levels by Late 2026: Educational Finance content will reach 90%+ AI Overview coverage within 12-18 months, matching where Healthcare is today.
The Opportunity Is in Educational Content: For financial services marketers, the path is clear: educational, explainer, and planning content is where AI Overviews are expanding. Optimize for these query types now — before saturation makes it harder to earn visibility.
Download the Full Report
Download the full AI Search Report — 18 Months of AI Overviews: What Healthcare Tells Us About Where Finance Is Headed
Click the button above to download the full report in PDF format.
Published on January 29, 2026
18 Months of AI Overviews: What Healthcare Tells Us About Where Finance Is Headed
Gemini's December Surge: What Citation Data Reveals About Where It's Sending Traffic
BrightEdge data shows Gemini surpassing Perplexity with a 25% referral traffic lead. Gemini grew 33% MoM in December after October upgrades, marking a key moment in AI Darwinism.
This week, BrightEdge released data showing Gemini officially overtook Perplexity in referral traffic share — a 25% lead and a landmark moment in what we're calling AI Darwinism. Gemini's referral traffic grew 33% month-over-month in December, signaling a meaningful increase in user engagement following the October model and product upgrades.
But referral growth only tells us that more users are engaging with Gemini. It doesn't tell us where Gemini is likely sending them. To understand that, we went deeper.
Data Collected
Using BrightEdge AI Catalyst™, we analyzed Gemini's citation behavior throughout November and December to understand:
- Whether citation depth and source diversity changed as usage scaled
- How week-to-week citation patterns shifted during December
- Which query intents saw increases or decreases in citation exposure
- What this means for SEOs trying to earn visibility in Gemini's answers
Key Finding
Gemini scaled without closing off. Despite 33% referral growth, citation depth, domain diversity, and publisher concentration all remained flat. But under the hood, Gemini became more dynamic — week-to-week variance increased 34% — and citation exposure shifted toward research and planning queries. Gemini is scaling as an open discovery layer, not a compressed answer engine.
The Stability Story: Gemini Grew Without Compressing
When AI platforms scale rapidly, there's a concern that they'll compress answers, reduce citations, or concentrate traffic to fewer publishers. Gemini didn't do any of that.
Citation Depth:
- November: 8.09 average citations per answer
- December: 8.06 average citations per answer
- Change: -0.3% (effectively flat)
Domain Diversity:
- November: 4.85 unique domains per answer
- December: 4.85 unique domains per answer
- Change: 0%
Top 10 Publisher Concentration:
- November: 23.7% of all citations
- December: 23.7% of all citations
- Change: 0%
Share of Source-Heavy Answers (10+ citations):
- November: 33.6%
- December: 33.3%
- Change: -0.3 percentage points (effectively flat)
What This Means
As Gemini's audience expanded in December, the platform maintained consistent openness to the web. No collapse in citation depth. No concentration to fewer publishers. No reduction in how often it produced highly-grounded, multi-source answers.
For SEOs, this is encouraging: opportunities to be cited in Gemini — regardless of your site's size — remained unchanged even as usage surged.
Under the Hood: Gemini Got More Dynamic
While overall citation volume stayed flat, Gemini's answer composition became more variable week-to-week in December.
Week-to-Week Standard Deviation:
- November: 0.117
- December: 0.156
- Change: +34% increase in relative variability
Coefficient of Variation:
- November: 1.44%
- December: 1.93%
Weekly Citation Fluctuation
| Week | Avg Citations | WoW % Change |
| Nov Wk 1 | 8.06 | — |
| Nov Wk 2 | 8.20 | +1.7% |
| Nov Wk 3 | 7.90 | -3.6% |
| Nov Wk 4 | 8.08 | +2.3% |
| Nov Wk 5 | 8.07 | -0.1% |
| Dec Wk 1 | 7.88 | -2.3% |
| Dec Wk 2 | 7.99 | +1.3% |
| Dec Wk 3 | 8.21 | +2.8% |
| Dec Wk 4 | 8.18 | -0.4% |
What This Means
The increased variance suggests active tuning and optimization as usage ramped. Gemini wasn't just scaling volume — it was adjusting how it composed answers week-to-week. This is consistent with a platform in active development, testing what works as adoption accelerates.
Query Intent Changes Everything
The most actionable finding: Gemini's citation increases were concentrated in specific query types.
How-To / Instructional Queries:
- November: 8.34 average citations
- December: 8.77 average citations
- Change: +5.2% (the largest category-level increase)
Travel & Planning Queries:
- November: 9.88 average citations
- December: 9.90 average citations
- Change: +0.2%
Comparison / Shopping Queries:
- November: 6.14 average citations
- December: 6.11 average citations
- Change: -0.5%
The Pattern
Gemini increased source grounding in "decision-support" moments — the queries where users move from exploration toward action. How-to queries, travel planning, instructional content. These are high-value research stages where users are learning, evaluating, and forming intent.
Meanwhile, transactional queries (comparison shopping, pricing, "best deals") saw no increase in citation exposure. Gemini held flat in checkout-adjacent moments.
What This Means
If you're only optimizing for transactional queries, you're missing where Gemini is building its connective tissue to the open web. The opportunity is in the research phase — the how-to's, the planning queries, the instructional content that helps users move from awareness to decision.
Why This Matters Beyond Gemini
Gemini isn't just the standalone Gemini app. It's the foundational model powering Google's AI products:
- Google AI Mode runs on Gemini
- Google AI Overviews runs on Gemini
- Apple's Siri is set to be powered by Gemini
Understanding how Gemini cites and connects users to the web matters beyond just one product. As Gemini's reach expands across Google's ecosystem and into Apple's, the citation behaviors we're tracking now will have implications across multiple surfaces where users encounter AI-generated answers.
What This Means for SEOs
Gemini Scaled Without Closing Off: 33% more referral traffic, but citation depth, domain diversity, and publisher concentration all stayed flat. The open web stayed open.
Decision-Support Moments Are the Opportunity: How-to queries (+5.2%) and travel/planning queries (+0.2%) saw citation increases. Transactional queries stayed flat. Optimize for the research phase, not just the purchase moment.
Active Tuning Means Active Opportunity: The 34% increase in week-to-week variance suggests Gemini is still testing and optimizing. Citation patterns aren't locked in — there's room to earn visibility as the platform evolves.
Monitor Gemini Now: With Gemini set to power Siri and already powering AI Mode and AI Overviews, this platform's citation behavior is about to matter a lot more. Anyone with AI Catalyst can track how Gemini's patterns are shifting in their own vertical.
Technical Methodology
Data Source: BrightEdge AI Catalyst™
Analysis Approach:
- Gemini citation data analyzed across November and December 2025
- Weekly aggregation of average citations per answer
- Query intent categorization: How-To/Instructional, Travel & Planning, Comparison/Shopping, and others
- Volatility measured using week-over-week standard deviation and coefficient of variation
- Domain diversity and publisher concentration tracked across the analysis period
Time Period: November 2025 (Weeks 44-48) through December 2025 (Weeks 49-52) and early January 2026 (Week 1)
Key Takeaways
Gemini Scaled as an Open Discovery Layer: Despite 33% referral growth, citation depth (-0.3%), domain diversity (0%), and publisher concentration (0%) all remained flat. Gemini grew without becoming more closed, more shallow, or more concentrated.
Week-to-Week Variance Increased 34%: Overall citation volume stayed flat, but answer composition became more dynamic. Gemini was actively tuning as usage scaled.
Research Queries Saw the Biggest Gains: How-to/instructional queries: +5.2% citation increase. Travel & planning: +0.2%. Comparison/shopping: -0.5%. The increases are concentrated in decision-support moments.
Gemini Powers More Than Gemini: AI Mode, AI Overviews, and soon Siri all run on Gemini. Citation behavior here has implications across Google's AI ecosystem and beyond.
The Opportunity Is in the Research Phase: Gemini is strengthening its role as connective tissue to the open web during learning, planning, and evaluation moments. Brands that optimize for these stages — not just transactional queries — will capture more visibility as Gemini scales.
Download the Full Report
Download the full AI Search Report — Gemini's December Surge: What Citation Data Reveals About Where It's Sending Traffic
Click the button above to download the full report in PDF format.
Published on January 22, 2026