Core Web Vitals: Preparing for the Page Experience Update

What is the Google Page Experience Update?
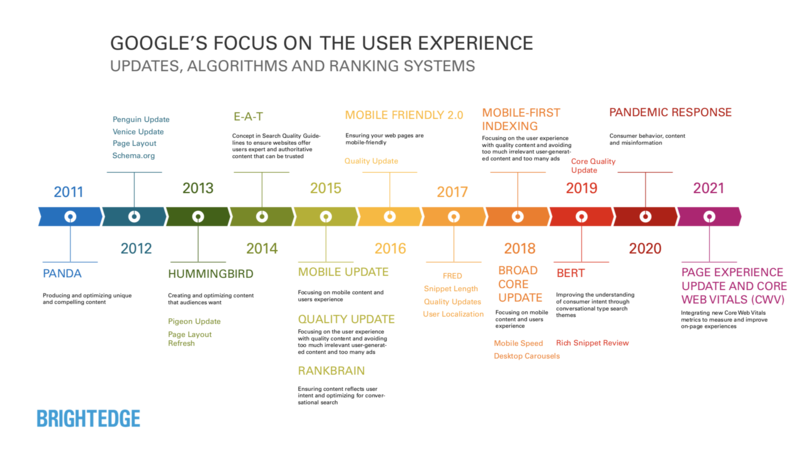
This will be a major update to the Google algorithm that will bring a wide variety of metrics known as Core Web Vitals together to form a page experience ranking factor. It’s slated to occur in May of 2021, so you have some time to address any changes that need to be made to your site.
DOWNLOAD THE FREE CORE WEB VITALS WEBINAR
How is this different?
Google rarely announces algorithm updates before they’re released, so this will have a significant impact on how Google ranks websites. The impact on individual websites may be minimal, especially for industries that have already prioritized page load times and quality UX, but may be significant to niche ecommerce websites, news blogs and more with outdated user experiences.
Google is continuing their charge of improving mobile web performance here. Starting with the shift to https (helping to remove the stigma surrounding purchasing on unsecure networks) and then the change to mobile-first indexing, Google has made it clear that mobile search is the future. Now, through rewarding fast loading sites, Google is laying out the roadmap for successful online businesses and websites.
What are Core Web Vitals?
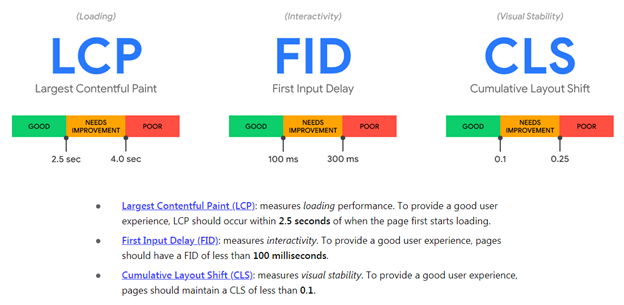
Core Web Vitals, are three metrics that score a user's experience loading a webpage. These metrics score how quickly page content loads, how quickly a browser loading a webpage can respond to a user's input, and how unstable the content is as it loads in the browser. These three metrics are going to be bundled alongside Mobile Friendliness, Safe Browsing, HTTPS and Intrusive Interstitials into a signal Google is calling the "Page Experience Signal".
LCP – Largest Contentful Paint
This is simply put as the point in which a page’s main content has loaded. You may have heard your Dev Team or an SEO mention things like the DOM or DOMContentLoad in the past. That’s similar, but Google is claiming that this is a simpler measurement that looks at the render time of the largest visible image or text block.
So, in other words, if you have a large image on your site, or a video background that takes a long time to load, you’re in trouble.
Likewise if you have a large amount of render-blocking JS or CSS (another favorite SEO & Dev topic), or your site is setup with client-side rendering, you’ll likely have to spend some time in the next few months improving your LCP to better meet Google’s new guidelines.
CLS - Cumulative Layout Shift
Have you ever been on a website when the entire content shifted up or down? Sometimes more than one element shifted or shifted multiple times. Almost as if the layout shifted each time something loaded on the page and it all added up to a bunch of shifting in a, more or less, cumulative manner…
Yeah, you guessed it, this is finally being flagged as a terrible user experience.
The Google web.dev group shared this fantastic video that highlights this experience:
Captured so perfectly…
So, how do we understand and address this issue? Basically, resources and content are being loaded to the page after and above existing content. Maybe you have an image that’s too large and you’ve chosen to defer it to after critical content is loaded. Maybe there’s an ad that pushes down content after you’ve loaded everything else on your page. Maybe there’s a sidebar widget that pushes the main article to the right.
All of these are examples of layout instability that count towards a Cumulative Layout Shift, which is a measured by a score based on the sum of all the unexpected layout shifts.
FID - First Input Delay
When we load webpages in a browser, as users we usually have an expectation that the second we see a visual element, like a button, an image, or a scroll bar, load on the screen that the page is immediately ready to receive my input. This expectation is that we can click the button or scroll down the page, even if the page still appears to be loading.
We find it frustrating when our experience does not meet that expectation and a page does not begin to respond to our actions.
The reality is that often the browser can’t respond because it is busy parsing a large JavaScript that controls an on-page function. While the browser is loading this file, it does not have the necessary resources to run event listeners that would respond the user’s input.
First input delay (FID) helps quantify this user frustration into a user-centric metric. It is important to note that FID does not measure the event processing time or the time it takes to render changes to page layout or content, only the delay in processing the event initiated by the user.
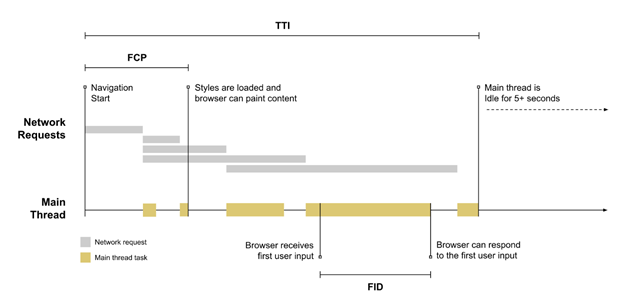
In the above example, which can be found at https://web.dev/fid/, we can see a solid example of FID measurement. In this scenario, a user has begun loading the page. As the page content load and begins to render the browser’s main thread is busy running tasks like loading a JavaScript file.
The page has already begun to load visual elements, and the user sees something of interest and tries to interact with the page. Since the main thread is already actively engaged in other tasks, it has to delay acting on the user’s input until the current task is completed. The time between when the user tried to engage with the page and when the browser can actually respond to that user’s input is FID.
Evaluating your Core Web Vitals
Now that we know all about the Core Web Vitals, how do we find out where our pages stand? Thankfully, there are a few ways to analyze your site.
Using Google Search Console is the easiest way to address multiple pages on a large site. GSC has a section under Enhancements in the main navigation where you can see the number of pages on your site affected by each Core Web Vital.
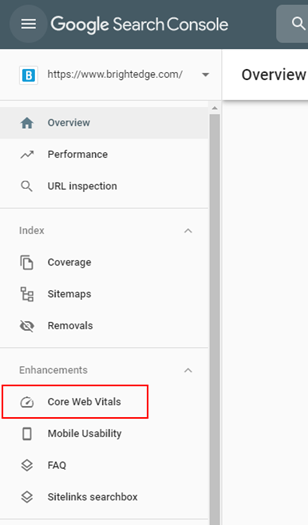
After clicking through to this section, you’ll see a report for each Core Web Vital issue where your site may be struggling.
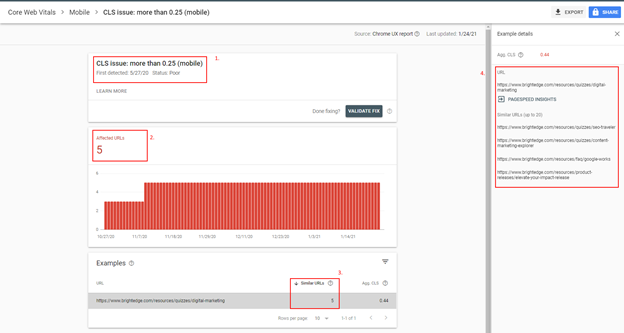
As you can see in the example below, the brightedge.com site has a minor issue with CLS. 5 of our pages have a CLS issue. I’ve highlighted how to best read this report:
- The issue and guideline, in this case CLS greater than .25
- The number of pages on your site that are affected by this particular Core Web Vital
- An example page where this issue is occurring. This is a key differentiator between this report and other GSC reports. The Core Web Vitals reports won’t show you every page you need to fix. Frankly, that would be a slow and painful way to address all the Web Vital issues as you’re likely going to need fix things on a templated level to fix more than one page at a time.
- A list of up to 20 similar pages where this issue is happening. Each example URL will show you some similar pages. Google is using this method to highlight where the same issues found on your example page are found on other pages throughout your site. For example, if you have an issue on your /blog/ and the same issue is happening on pages in your /press-releases/ section, you’ll only see the one of those in the example urls, but the other will show up in example details. This should suggest to you that more pages in /press-releases/ will need the same fix.
Fixing your Core Web Vitals
Now that you better understand what each Core Web Vitals metric is measuring and how they represent pain points for your audiences trying to access your content and engage with your brands, it is time to take action to improve these metrics – but more importantly, improve your engagement with your audience.
Each site is going to be somewhat unique. It would be rare for two separate sites to suffer from exactly the same issues – so it’s important to really dig into and analyze your domains individually to prioritize updates that will be the most beneficial.
Of course, there are more common issues websites face, and subsequently we can point to common fixes for issues that you may face.
Common activities to address LCP
- Apply instant loading with the PRPL pattern
- Optimizing your Critical Rendering Path
- Optimize CSS files
- Optimize image file sizes and compression
- Optimize or remove web fonts
- Optimize or reduce your JavaScript (for client-rendered sites)
Common activities to address FID
- Reduce the impact of third-party code
- Reduce JavaScript execution time
- Minimize main thread work
- Keep request counts low and transfer sizes small
Common activities to address CLS
- Include the size attributes on your images and video elements or reserve the space with CSS aspect ratio boxes
- Never insert content above existing content, except in response to a user interaction
- Use transform animations instead of animations of properties that force layout changes