Download our latest white paper to understand 4 key factors that Google looks at when choosing a page to show up in the rich box. Follow step-by-step process from choosing the best opportunities to optimizing for Quick Answers and measuring success. Learn 20+ optimization best practices that maximize your chance of getting into Quick Answers.
The Fathom Education SEO team decided to conduct an experiment to leverage local search to understand ranking differences in various markets. Often educational institutions have difficulty understanding search-engine optimization at the national level, due in large part to the competitive nature of the digital education space. Instead of going up against 3-5 competitors, as is common in many industries, educational institutions and their marketers often contend with hundreds of competitors for each program offering. Understanding how rankings fluctuate from local market to local market would provide a clearer sightline into the educational marketing landscape and opportunities for optimization.
Experiment Scope:
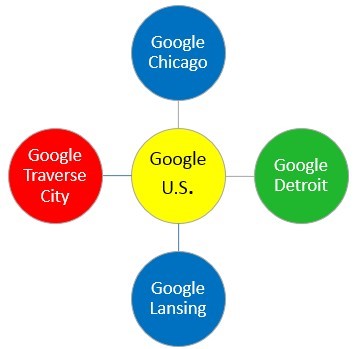
The team identified an ideal client and looked at its tracked keyword set to identify which keywords would be nominated for local-level tracking. Utilizing marketing leading technology from BrightEdge, they identified relevant Google local search engines: Google Chicago, Google Detroit, Google Lansing, and Google Traverse City (fig. 1.0). They then created custom dashboards to track and visualize keyword movement.
With the help of the customer success team at BrightEdge, data collection for this experiment occurred between September 2014 and December 2014. Only keywords which were ranked for each of the tracked weeks were included in the data set; if a keyword went unranked during one of the weeks, it was excluded.
Fig. 1.0 – Google Search Engines
Experiment Subject:
The subject of Fathom Education’s local search ranking research was Central Michigan University, a public institution in Mount Pleasant, Michigan, 150 miles northwest of Detroit. Offering over 200 academic programs, with an undergrad enrollment of 20,000+ students, Central Michigan University is one of the country’s 100 largest universities. It was ranked as the #194 national university by U.S. News & World Report in its most recent college edition.
Experiment Hypotheses:
Certain markets would emerge stronger than others, particularly in the search engines closest to campus. Non-branded terms would have larger ranking variances than branded terms.
Findings:
Branded vs. Non-Branded
The Fathom Education team initially grouped keywords into two segments: One bucket for branded keywords, and the other for non-branded keywords. This segmentation was important to test the hypothesis that branded keywords would be less prone to ranking shifts across the timeline of the project.
Central Michigan University’s branded keywords maintained similar rankings in the local search engines compared to the Google US baseline. On average, branded keywords in the local search engines remained within 1.43 positions of Google US rankings.
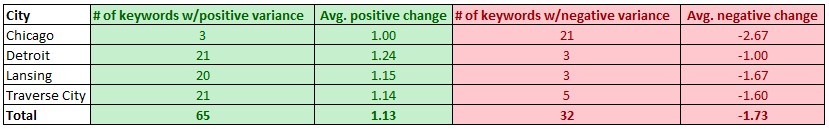
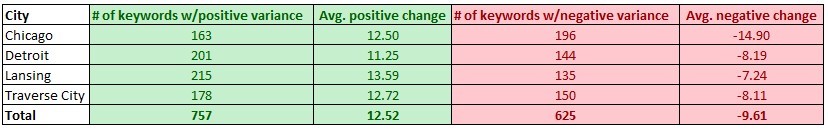
Detroit saw the largest positive branded ranking variance from Google US, and Chicago saw the largest negative variance (figure 1.01).
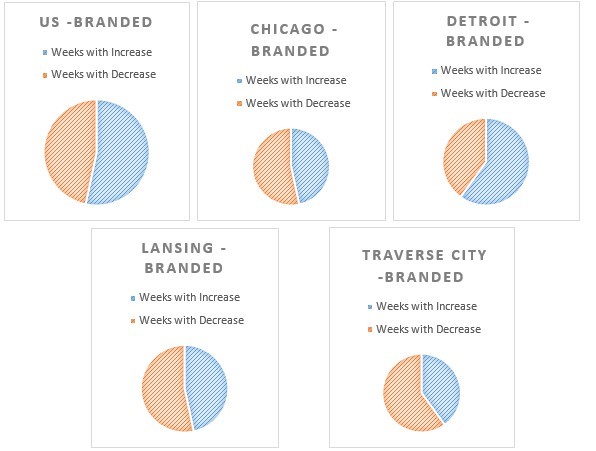
Figure 1.01 - Branded keyword ranking variance from Google US baseline
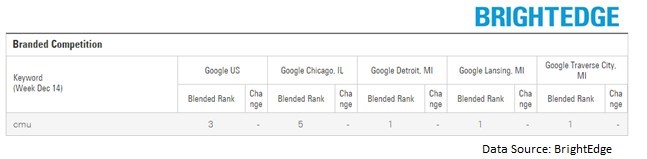
The most consistently variable branded keyword was the acronym CMU, where lower rankings were observed in local search engines due to competition from Carnegie Mellon University (https://www.cmu.edu/index.shtml) (fig. 1.02).
When examining branded keywords in each search engine across the timeline of data collection, Detroit saw the most weeks with ranking increases, while Traverse City had the most weeks with ranking decreases (fig. 1.03).
Figure 1.03 – Branded performance by week
Much larger ranking variances were noted in the local search engines from the non-branded keyword segment. On average, non-branded keywords experienced an 11.06 position ranking difference from their Google US ranking baseline.
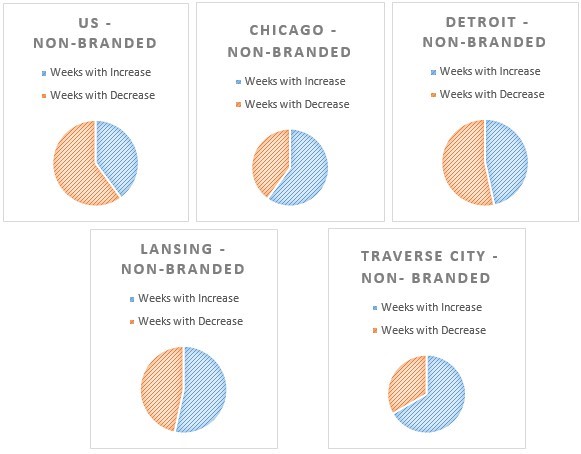
The Lansing search engine had the largest positive non-branded ranking variance from Google US, whereas Chicago had the largest negative ranking variance (figure 1.04).
When compared to initial non-branded keyword rankings, Traverse City experienced the most weeks with ranking increases, and Google US experienced the most weeks with ranking decreases across the research timeline. (fig. 1.05).
Figure 1.05 – Non-branded performance by week
Stability vs. Volatility
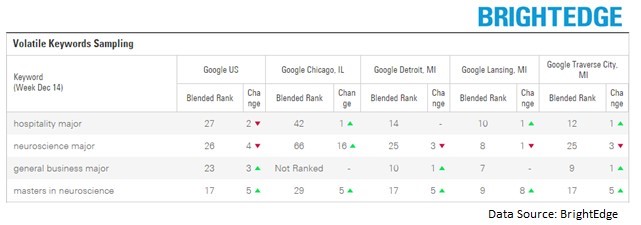
As the experiment continued, the team noticed ranking trends and created two additional keyword segments: stability and volatility. The stability segment was made up of branded and non-branded keywords with very little ranking variances; these words were predominately situated on the same search results page across the 5 tracked engines. The volatility segment was populated with non- branded keywords that had varied page rankings in the different search engines, or significant swings in rankings week over week (fig. 1.06).
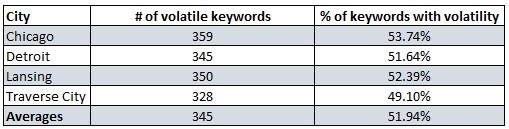
Tracking these two segments was important in calculating what percentage of our focus keywords were “volatile.” In total, the following non-branded keyword volatility percentages were exhibited throughout the course of the experiment: Chicago – 53.74%, Detroit – 51.64%, Lansing – 52.39%, Traverse City – 49.10%. On average, 51.94% of tracked non-branded keywords were volatile (fig. 1.07).
Figure 1.07 – Volatile keyword percentages
Universal Search:
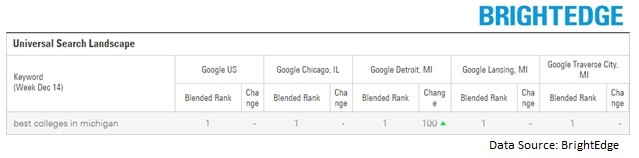
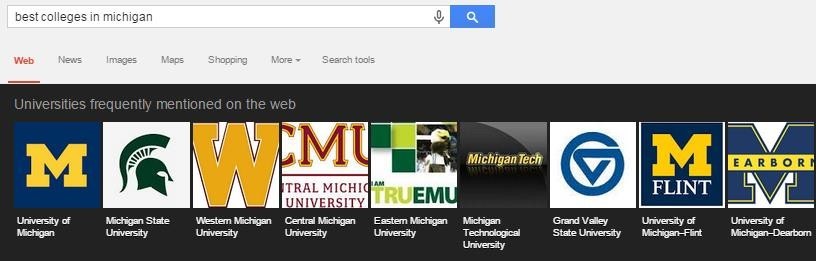
In addition to fluctuations in traditional search results, the team also recognized variations in universalsearch results. At times Central Michigan University had universal listings ranking in the first position in the local engines, then dropped into lower positions in subsequent weeks. This back-and-forth demonstrated shifts in Google’s algorithm and highlighted how search results can be affected (fig. 1.08, fig. 1.09).
(Central Michigan University gained 100 ranking positions in the Detroit search engine week-over-week with a “carousel” listing in the universal search results.)
Fig. 1.09 – Universal Search Carousel Listing
Summary
Experiment Wrap-Up:
Examining the data and findings, Fathom Education was able to confirm its hypotheses. In fact, non- branded keywords did display a higher risk of volatility than branded keywords, and the search engines closest to the physical campus typically resulted in higher rankings for these keywords than the Google U.S. results.
Expanding on these insights, Fathom developed a set of guidelines and local-search best practices for colleges to consider as part of a comprehensive digital marketing strategy.
Local Search Practical Application:
We recommend reviewing and implementing the following to improve your own institution’s local search presence
1. The first thing you’ll need in order to have a successful local search strategy is localized rank tracking. Without knowing your baseline ownership of the local search results, gauging improvements will be hard. We recommend BrightEdge for ease of functionality and the most in-depth reporting.
a. If you’re trying to settle on which keywords you need to invest in for local rank tracking, start by looking at your branded keywords. If your college has a strong brand presence and generally sees little branded competition, leaving branded tracking at the national level is probably ok.
b. Looking at Fathom Education findings for Central Michigan University, just over 50% of the tracked non-branded keywords were considered “volatile,” and displayed larger variances between the national and local engines. Knowing that, consider nominating 50% of your non-branded keywords as critically important to success, and start tracking them geographically.
c. Start near home. Recent ACT data suggest that the average student will travel less than 50 miles to attend college, with 78% of students remaining in-state for their education. Therefore, honing in on local search engines will help keep focus on the most potentially valuable sources of new students.
2. Next, you’ll want to define pertinent goals for local search. All local engines will not necessarily perform the same, and seeing wins across the board will be doubtful. So, setting realistic benchmarks is important to help you celebrate each individual feat. Whether an increase in traffic to a new program page, a boost in applications for the fall session, or more social shares for a premium video, knowing what you want to accomplish will help provide a clearer picture of your success.
a. Once those determinations have been made, set up goals and/or event tracking in Google Analytics and utilize annotations to mark important changes and achievements.
3. Cover your on-site foundation. Ensuring the following basic pieces are in place will give you the best chances of seeing success in the local engines:
a. Utilize geographic modifiers in the title tags of relevant pages. Including your city or state in your title tag will signal local relevance to both the search engines and the searchers. Doing the same in your meta descriptions will help click through rate on your organic listings.
b. Optimize your college’s ‘location’ pages. Beyond the title tag and meta description, include the following information on your location pages: schema location mark-up, embedded Google Maps, zip codes, distances from other regional cities, detailed directions, and local landmarks. All of these will provide semantic location details to the search engines and help increase your chances of achieving first-page rankings.
c. Utilize all your available content. Images, videos, and PDFs should be treated the same as other on-site content. Optimize them accordingly with alt attributes and meta- descriptions.
4. Be mindful of universal search. Beyond images and videos, think of the other types of results that are appearing in the search engines: Specifically for colleges, "carousel" and "places" listings. Optimize your Google Places presence by creating a page for each satellite or regional campus. Additionally, consider marking your upcoming events with schema code so the search engines will pull them directly into the results pages.
5. Understand your existing rankings and tailor content towards the locations where your institution is struggling the most. Consider developing a landing page or microsite where you can house localized content to help address the issue. Taking advantage of offsite advertising such as radio spots or billboards in areas of concern could also drive traffic to a website and increase engagement.
6. Build credibility with local institutions. Is your city known for its hospitals? Or maybe its theater district? Form relationships with these organizations to signal strength in the eyes of the local search engines. Earning a relevant link from credible sources to your program pages or promotional content will result in more traffic to your site, as well as boosted ranking potential.
7. Let paid search be your friend. While paid search does not represent the answer to organic local search needs, creating a unified approach to digital marketing can assist in achieving goals.
a. Support struggling organic rankings with increased bids in paid search campaigns. While waiting for the effects of SEO, searchers in your underperforming locations will be able to see your content in the top slots of the results pages.
b. By contrast, current leaders in organic search who consider increased domination of the search results page with enhanced paid bids could help combat pressure from both existing and up-and-coming competitors.
8. Build awareness outside your core market. As we saw throughout the analysis, there’s a greater likelihood of variability in rank position in local markets outside of that which the university is actually located. Search engines take into account the importance of content to users in a specific locale – therefore localized citations (i.e. brand mentions and links) originating from sites with a footprint associated closely to a location can influence your rankings across markets.
a. For example, consider that CMU saw a higher negative variation in rank in the Chicago market vs. Google US. In order to increase relevance for the targeted terms in the localized Chicago search results, we might suggest utilizing existing partnerships or marketing initiatives to gain additional citations in that market. One such practical example might be to launch additional press around a booth at a college fair in Illinois. Or, if CMU is partnering with a hospital in the Chicago area on cutting-edge medical research you can take that as an opportunity to generate powerful localized citations.
*During the duration of this project, some, but not all pages of the subject site were edited. The Fathom team tracked a variety of non- optimized keywords to limit the effects of site modifications on the experiment. Looking at the trend of the results instead of one metric or data set provides a clearer perspective on the landscape.
Mining data can be nebulous, overwhelming, confusing, and geared toward paid media. It can also be difficult to figure out where to start. Once you pick a place to start, mining for scale can be difficult among the team. Internally, SEO teams need to figure out a way to find a balance between the right tools and the right training to drive scalability.
THE SOLUTION
Matt Saunders, Director, SEO Strategist at Rosetta agency, faced this issue with his global team. He decided to leverage BrightEdge’s Data Cube to mine big data for all facets of content marketing research, including blog content, rich media, and local search. His first step was finding colleagues across the teams to determine who could benefit from the platform and who would be a good advocate for it. Creating that core group of people, training them daily, and getting them all BrightEdge certified allowed valuable knowledge transfer to all of the other SEOs in the company instead of Saunders being the single point of contact for mining big data.
THE RESULTS
Matt successfully got several members of his team ramped up to scale data mining and found multiple ways to gain valuable insights each within 60 seconds. Using BrightEdge’s Share of Voice report, the team was able to find content expansion ideas by taking competitor URLs, putting them in Data Cube, and finding new keyword and page opportunities, which resulted in 6 new target keyword representing 37k monthly searches. Aligning rich media with the SERP landscape, Data Cube revealed how large an opportunity can be with rich media based on competitive insights and SERP landscape. For Local SEO optimization knowing which queries trigger local listings is half the battle. Saunders quickly saw in the data that local points of interest were a substantial untapped opportunity. The Google SERP carousel has ramped up the urgency for local optimization as prominent competitors become more visible across a substantial number of carousel results. Putting competitor names into Data Cube yields keywords that trigger local listings which in turn can substantially increase your local footprint.
That’s really what Data Cube is built on... Doing all of this complex gathering of information and making it super easy for you to get actionable insights out of it.
Yelp Simplifies Local Search Management with BrightEdge
As search becomes increasingly local, SEO strategies and technologies that do not address local could miss out on a large opportunity - with a shortfall of upwards of 30%.
With Local Search Management from BrightEdge, Yelp is able to manage local SEO in major markets and ensure that users searching for information on local businesses can easily find Yelp reviews.
In this case study you will learn effective tips for local SEO, including:
Gaining visibility on current performance
Registering your local business with search engines
Establishing a strong presence on online local communities
Search Engine Results Pages (SERPs) no longer only feature classic text-based results, but have evolved to include universal results: image, video, social, and local results. Practitioners now need to know the rank of their pages among universal results in order to get an accurate picture of what the user sees during searches.
BrightEdge S3’s unique Blended Rank and Local Search Management technology, which are accessible in dashboard charts, provides complete insight into search performance.
360 degree Blended Rank Analysis
Measure true content performance - Utilize dashboards to get an immediate understanding of search engine rank among all search results including text, image, video, social, and local results.
Competitive Intel based on Blended Rank - Track your competition’s Blended Rank across all your keywords; identify competitive trends in Blended Rank, quickly take corrective action.
Correlate social signals and Blended Rank - Correlate social media activity such as Likes, Shares, Tweets, and +1s with blended rank while managing social media campaigns to increase universal search result rankings.
Impact of Blended Rank on web analytics - Understand and manage the impact of blended rank on your digital strategy, and how this impacts real business results such as revenue, traffic, and conversions.
In-depth Local Content Performance Insight
Make performance local - Respond to the rise of local results in SERPs by creating content performance strategies aligned with local user preferences.
Granular keyword analysis - Gain in-depth visibility into local performance by keywords and keyword groups.
Target the largest search geographies - Target SEO for 141 major cities.
Local dashboards - Customize dashboards to show local performance for individual cities and identify performance variances by city.
We adore Blended Rank, it’s really vital for our company - not just from an image or video, but specifically from a Local Search perspective. Being in the hospitality industry we need to make sure that we understand the full spectrum of the search engines results page from local to organic. Blended rank really helps us understand from a natural search listings perspective where we actually stand and how much of those pages we can dominate.
Local SEO and Content Performance
Search engines have taken the next step in providing the most relevant results to consumers – displaying different results pages for small geographical locations, even cities that are just miles apart.
Identical queries issued in two cities just a few miles apart result in different local 3-pack rankings
With digital experiences varying according to location you can get a skewed view of content performance if you neglect local SEO and confine your analysis of organic demand (search volume) and content performance (organic ranking) to a single location, such as a large metro area.
Instead, it’s critical to understand how your customers experience search locally, and to optimize your local SEO for the specific locations that matter to your business. Only BrightEdge provides the volume and granularity in search insights to help you hone in on and connect with target audiences in key regions.
Evaluate content experiences from your customers' viewpoints
With enhanced HyperLocal capabilities, the BrightEdge platform is the only SEO solution that allows digital marketers to understand how topics and content perform for searches conducted in every corner of the globe.
Access search volume and rank data for search engines in over 32,000 US and 36,000 non-US cities across desktop and mobile. Or, add custom locations, like retail store addresses, for an even more granular view. Get the clearest and most accurate look at how pages are performing in the specific locations that are the most critical to business success.
Target customers according to residence or other location-based criteria
When you have location information for your target audiences – such as their cities of residence or other location-specific data – track, assess, and optimize content performance to ensure that you display prominently in the SERPs for these locations.
Drive customers to local brick-and-mortar locations
Organic is no longer solely a driver of online traffic; with the growth of mobile search, local SEO is also a significant source of physical traffic to brick-and-mortar locations. View performance for the local search engines closest to each of your storefront locations and optimize to beat the local competition.
Assess trending of your brand visibility in key markets
View how your brand has performed compared to major competitors in key markets over time. Trended performance data allows you to zero in on where you are missing out and where improvements will help you beat the competition.
Secure the most granular local SEO insights on search demand across the globe
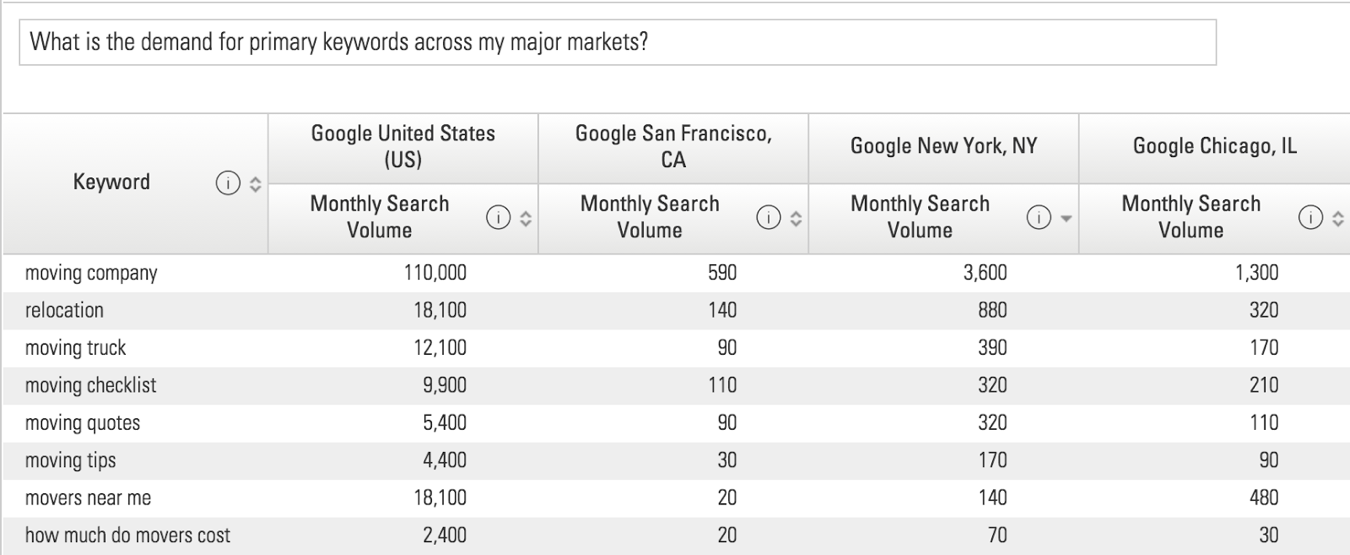
Investigate fluctuations in search demand across multiple locations
Interest in and demand for the same products can fluctuate greatly across locations. Track and compare the search volume across various geographical regions to understand differences in demand and allocate resources where opportunity is the greatest.
Select regions for intentional expansion – with confidence
With access to over 36,000 international search engines, and the ability to set custom locations, you can view and compare search volume across different locations across the globe to understand where there is the highest demand for your products and services.
As the only search and content solution that provides insights at the greatest volume and highest resolution, BrightEdge enables digital marketers to understand how pages are performing in the specific locations that are most critical to their business success.
Its capacity to scale to handle our traffic from around the world and monitor the performance of our SEO efforts and our site rankings is incredible.
Hyper-local SEO is core to the business of managing our hotel clients and giving them the competitive advantage.