
Mining Data for SEO and Content at Scale

Sure, you’ve got content – but how is it performing? Is it targeted to what our users are searching for? Is it producing results? These are the questions explored in this session at the BrightEdge Share 14 event, which wrapped up last Friday. Brands like Adobe, OpenTable, Rosetta and SearchLaboratory all gave tips on how to mine data for content and SEO performance insight. Denis Scott of OpenTable was up first. Just some of the questions data can answer, he says, are as follows:
- Business trends
- Types of customers
- Sources of traffic and impact on results
He’s going to focus on the last point. At one point, OpenTable and toptable needed to do a brand/site migration when OpenTable acquired the other. They had a lot of work ahead of them, says Scott.
OpenTable created a forecast for what the traffic might look like first on a line graph. They needed to show the strategy was working, so apart from traffic data, they wanted to look at other factors like PageRank, Scott says. And the team created weekly dashboards in BrightEdge to organize it visually.
The data showed that even though there were traffic dips, there were positive SEO signs. And data was measured in other channels, too, like PPC and email, during the rebrand. Scott says they put together PPC and SEO campaigns to see how it looked year over year, and found where SEO dipped, PPC picked up.
The takeaways, says Scott, are:
- Start with what you need to answer
- More data will exist than you need
- Tell the obvious story which is usually the answer
Next up was Chris Attewell (@twitter) of SearchLaboratory. He used Wal-Mart as an example for his talk on keywords. For a large retail sitelike Wal-Mart, each category may have multiple subcategories on the site. So, where do you focus? he asked. What keywords do you look at?
You need a strategic view to know where you can get the best ROI, says Attewell. The challenge is that there is a lot of data coming from multiple data sources, and putting it together into a meaningful, actionable system is key, says Attewell. SearchLaboratory used the “opportunity forecasting” tool in BrightEdge often to get a better picture of strategy.
Here are some tips, says Attewell, that came from how they went about mining keywords: Build new keyword groups – break it down into words, like “dresses” or “maxi” or “maternity,” then look at keyword group search volume. Measure the effectiveness of keyword groups right within BrightEdge, he says.
Then, mine the long-tail terms to uncover some great trends when doing so. In their research, they found “peplum” as a great opportunity that they weren’t even tracking.
Attewell says they also group keywords for seasonality, and prioritize for international markets. Here’s a tool that SearchLaboratory created a tool that allows people to slice and dice keyword data, available on their site, here. The next speaker was Kirill Kronrod from Adobe. Kirill’s talk is centered on the search impact lifecycle, and how SEO data fits into it. [Side note: Check out Kronrod’s guest post on the search impact lifecycle for the BrightEdge blog, here.]
He shared a content case study. He had a product that had only one page on features, and was dense in content. Because of all the topics on one page, Google could not distinguish the theme, he says. So, the SEO team wanted to spin out 15 pilot feature pages, each focused on a specific feature, to see if it moves the needle.
Based on pilot findings, the team expanded the pilot to 30 pages, says Kronrod. The results were a growth in traffic and conversions, and a greater Share of Voice showing in the BrightEdge data. Another case study in utilizing data was targeting Hreflang. They used BrightEdge to see rankings for targeted keywords across geos. As soon as they implemented Hreflang, they saw significant ranking improvements, more than a 720 percent daily visit boost.
A third case study Kronrod shared in data mining was migrating to a CMS, and determining if it would be a good move. They used the BrightEdge Data Cube to validate the impact of the migration of pages. They also used BrightEdge for rankings and looked in Adobe Analytics for conversions. They were able to determine that the move was a good idea.
The takeaways, says Kronrod:
- Focus on the right data
- Align reporting to the stakeholders
- Prioritize recommendations
- Do a pre- and post-analysis, tell the story
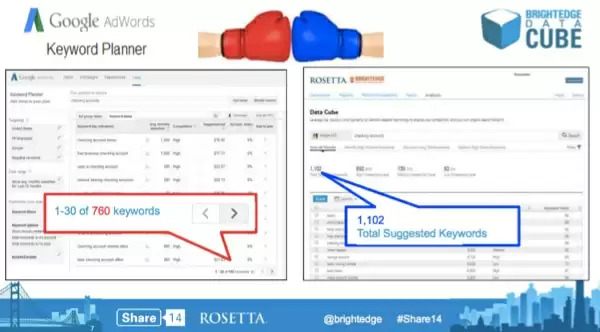
Matt Saunders of Rosetta was the final speaker. He talked how to mine big data quickly. Big data: where to start? Go to the BrightEdge Data Cube, he says. It’s a complex gathering of information, and makes it easy to get insights, says Saunders. Here, he shows the Data Cube going head-to-head with a keyword tool:
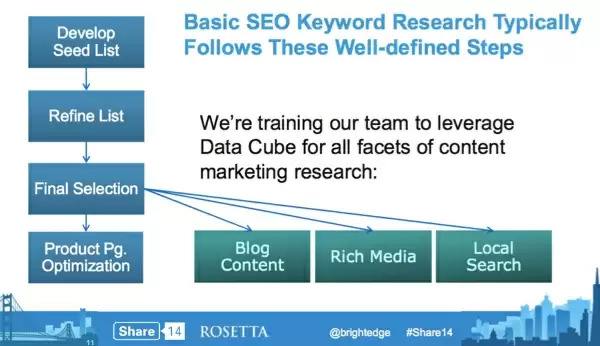
Saunders said the basic strategy for keyword research and analysis is outlined in the following slide:
Next, he shared four use cases in data mining. The first was competitive gap analysis. His team needed to identify content expansion opportunities around wedding bands. So they checked out the Share of Voice report, and found Overstock.com had a significant share of voice due to one particular URL. If you dig down into the tool, he says, you can see what a page that is doing well is up to and what they are ranking for. You can identify a handful of new terms you may not have tracked before.
Another scenario on the content marketing side. Look at a URL for the competition, and paste it into the BrightEdge Data Cube, and you can see how you stack up against competitors.
Another scenario is gauging rich media opportunity, says Saunders, through the BrightEdge tool.
And, finally, Saunders shared a use case for local optimization and Google’s local carousel results. He says you can build out a strategy to see which terms trigger carousel results in the aftermath of Pigeon, for example.