
The Value of StoryBuilder
The world of content development is becoming increasingly competitive. According to the Content Marketing Institute, 86 percent of B2B marketers report that their organizations are using content marketing and 70 percent of them are creating more content than before. Businesses are recognizing the value of online marketing, which means that the space will become even more saturated. The saturation will also be coming in the form of high-quality content.
The past year has also seen several algorithm updates that have been aimed at raising the bar of the content available online. As brands respond to these updates, it will be even more of a challenge to rank well and reach more audiences. The key to overcoming these challenges is to use data to monitor each phase of the customer journey. You want to look carefully at your content strategy and gauge how well customers are finding your content and how they are responding to what you have to say. Just looking at page views will not give you the strategic insight you need about how you compete with others in your industry. You will also not be able to see the contribution of specific content investments in terms of revenue and engagement.
Bridging the gap between raw data and real-business context
Telling a data-driven story is not always easy, however. First, as marketing technologies evolve and reach more audiences online, more information is being generated across the different channels. This includes data such as rank, share of voice, revenue, revenue per visit, conversions, visits, conversion rate, bounce rates, average time spent on site, page views, backlinks, indexed pages, viewability, interaction rates and video completion rates.
With BrightEdge StoryBuilder, you can analyze nearly any metric that might be valuable to your brand. This includes metrics from BrightEdge, along with other metrics from your Web Analytics and third-party systems. Rather than trying to make sense of the raw data or metrics derived from your campaigns, StoryBuilder helps to elevate the value of your story by translating the data into metrics that matter for your business, told in a way that is relevant. For example, instead of analyzing “visits” or “rank,” StoryBuilder helps to uncover the value of this data by linking it to questions in context of the brand’s marketing goals and desired business outcomes. So if you are in retail, where your business is highly seasonal, your goal could be something like: "I want to grow revenue by 30% year-over-year for a product category through organic, paid and social channels."
Instead of looking at revenue data, you might ask more probing questions, such as:
- How well has revenue been performing this season vs. same time last year?
- Are we following the same cyclical performance trends, or are we under performing?
- Which are the key channels that drove the most revenue per visit?
And if there is a shortfall in revenue, you might investigate and ask: “Was there a decline in visits?” And if engagement and conversion are higher than a prior period, you might ask:
- Where are people visiting, and where are they most engaged throughout their customer journey?
- What were the compelling offers used in high-converting pages?
If your marketing strategy is to increase brand awareness but you have a smaller budget, you could look into organic channels and investigate:
- How well am I competing for market share in organic search?
- Which product categories have the highest market share on organic search, and which have the lowest?
- What can you do to increase your market share?
With BrightEdge StoryBuilder, you no longer need a data science degree or data analytics expertise. Instead, BrightEdge integrates data from the various digital marketing channels and translates the data into questions that map to a business context. So rather than pulling data into Excel and analyze offline, you now have the answers you need immediately.
The Scope of StoryBuilder Capabilities
We have assembled a Questions Library that was developed based upon our experience working with over 1200 customers and brands worldwide. It is now available to help you accomplish your goals. 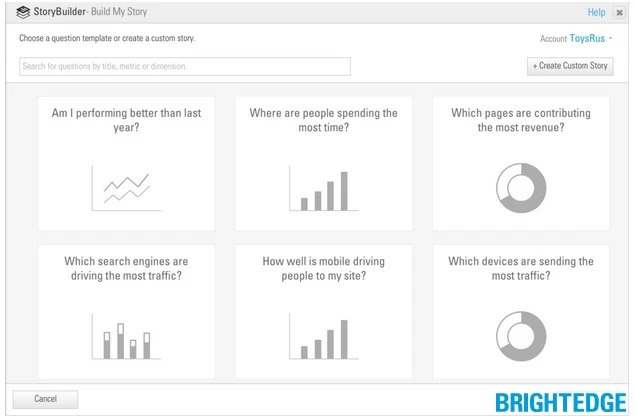 Say you wanted to increase your brand reach and traffic. You can use the StoryBuilder to find the answer to insightful questions such as:
- Which organic search engines are driving the most traffic?
- How well is my content reaching consumers on mobile?
- How efficient are we at acquiring customers through my paid and organic channels? Where should I reallocate budget?
- How well is my content competing on page one of Google? Who am I competing with?
- How well am I showing up in the top three positions on mobile?
- What is my overall Share of Voice and did it improve? Who is edging up and how?
- If your goal was customer acquisition or revenue YoY growth then find answers to:
- How well am I performing this year compared to the same time last year?
- Which content pages are top movers & shakers?
- How is revenue trending across our top product categories?
- How efficient are we at acquiring customers through these channels?
- What is the revenue mix by channel?
If your goal is to understand content relevancy and engagement you can check:
- How well is mobile driving people to my site?
- How efficient are we at converting customers?
- Which content is driving the most engagement?
- How engaged are mobile consumers with my brand?
- Where are we seeing the most drop-off in site engagement?
Regardless of the questions you might have, StoryBuilder can help you find the answer quickly. Create charts and graphs to make your digital narrative visual and engaging to fully grasp your online performance and where you have room to improve. 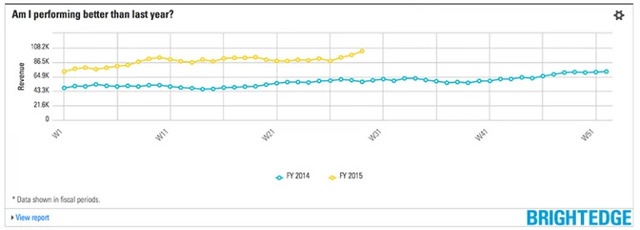 You can get answers to “how well are you performing this year compared to last year?” You can create new tables where you can compare valuable data points such as this week to last week, this week to the same week last year, week over week and year over year. For example, you might notice that while your current week is performing poorly compared to last week, your revenue compared to the same week last year has gone up.
The ability to apply numeric filters to cross tabs has also been added. If you wanted to compare keywords between two domains and see if a drop out of the top five slots meant that a competitor moved into the spot, you now can. These are just some examples that showcase how content marketers can elevate the value of their marketing outreach and results. With the StoryBuilder platform, we are continually looking for ways to improve the available capabilities so that you have access to the information you need to make sure your content succeeds in the increasingly competitive world of search and content marketing.
StoryBuilder can help you understand your brand reach, engagement and acquisition by providing you with the answers and insights you need to direct your marketing investments and remain one step ahead of the competition.