
BrightEdge Customer Column - How I Found 9 Million Dollars!

As I have managed SEM – one of the foundations that I always have gone back to is the functioning of the actual website that I am working on. I don’t want to spend hours, days, weeks or months of hard work growing traffic only to find out that the website does not work at its best! And with that experience comes some insights on how to use Google Analytics (a free tool) to measure some KPI’s that I like to monitor on a regular basis so that I can understand the health of my websites, and react to issues before they become critical issues, or lots of lost revenue. My name is Kevin Hill, and I have managed the SEM and beyond for websites from 5MM to 100MM. I'd like to share with you a particularly interesting story of my career - and how analytics and a sharp eye helped me find 9 million dollars by paying attention to the basics of website health including website speed, browser traffic and metrics, and content. I will also show you how to segment data on website health into actionable reports and items. I want to make sure you are not overwhelmed by a single statistic that blurs the details, but have small discreet values that actually represent groups of traffic or visitors that you can affect in clear and concise ways. Now, let's move on to finding those 9 million dollars!
Site Speed – Are you a Ferrari or a Moped?
Your site speed is important. Google tells us this, but also says don’t obsess about it. At SMX Advanced this year – Matt Cutts yet again spoke about it, and stated that 95% of websites are fine – and that you should not obsess about site speed. But that you should be aware of it. But that's really vague. How do I know if I am the safe 95%, or the 5% that are getting penalized? I like to look for data that can help me make decisions based upon observable patterns. And you and I are going to look at some data that will help us decide when to act, and when to dedicate valuable resources to an issue like site speed.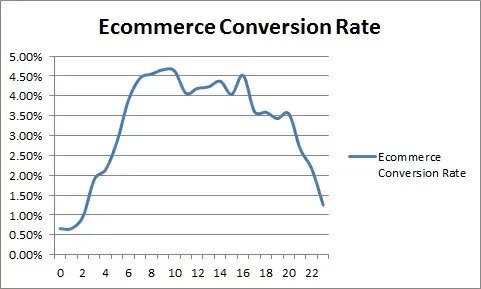
What I am looking for with a speed report, is a way to look over many days, and see patterns and changes to bounce rates and conversion rates. If I see a spike in one hour where conversion rate drops off dramatically, and page load time has spiked, I may have a problem with the back end of my website.
Normal activity might look like this:
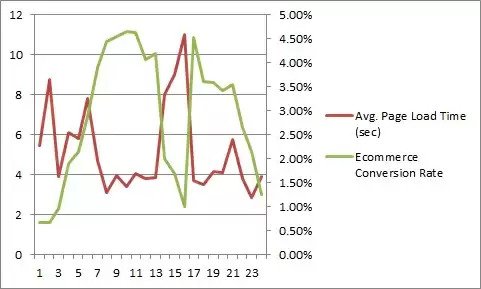
Or, you might see something like this – which means you probably have some work to do with your IT staff in looking at why you are seeing a spike in time to load a page, which is causing problems with conversion rates. Let's take a detailed look at the 2nd graph. In it you will notice that I have taken data from my report, exported all 24 hours to excel, and graphed the page speed column, and the conversion rate column. You can see between 1pm and 3pm something is going on with my site that drives site speed up to 8 and 10 seconds, and correspondingly, there is a large drop off in conversion rate during these times? If I saw something like this, I'd present it to my IT group, and ask them to carefully investigate. If, I had an IT group that was pulled in many directions, I might even run a model showing what website revenue might have been if the conversion rate stayed in the 3.5% to 4% range - and what this is currently costing us in lost revenue.I am going to give you a crystal ball to KNOW if sitespeed is important. It can tell you many things about how your site is performing day to day. You will notice that the standard reporting will tell you things like what your site does hourly, daily, weekly or monthly, but it won’t really give you information that you need to determine if it matters. How do we do that? Well, we generate a custom report with Google analytics that helps us to understand how site speed affects conversion rate, bounce rate and time on site. These few metrics will help us to start understanding what matters, and when.
What pages on your site need help?
Let's look at another important area. Pages on your site that are getting the most traffic. Do you have a page that is getting lots of traffic, but are not converting well, or below the site average? Here you can see that there are a few pages with lower conversion rates and decent traffic that I may wish to start diving into in more detail? Is there expired or old content on the page? Does the page have a call to action? What changes might I experiment with that could help me to increase the conversion rate on my site?
In looking at the above report, I immediately notice that row 5 looks really low compared to the rest of the pages. It's also one of the top 5 pages on my site (excluding the home page), so it is probably a page that I am going to want to pay attention to. I might furthermore run analytics on that particular page to find out page speed, number of unique visits, filter out all traffic that is local to my office and more so that I can better understand what my customers might be doing, or might not be doing on the page.
Watching Browser Activity – Is everyone seeing what you expect them to?
Browsers are what your customers use to look at your site. And if your site has problems that only appear on certain browsers, you are loosing revenue that you could be earning from those visitors. It’s important to monitor all browser versions and make sure that they are working effectively. Most websites will test certain versions of browsers, but we need a better way to do this. Particularly when new versions get released, and we may or may not know about it. How can we do this? It's really difficult to look at the Google Analytics standard browser report and page back and forth between browser types, versions and see the overall picture of what is happening, without either a great memory, or lots of excel slicing and dicing. Let's setup a custom report so that it's all in front of us in one page. Below is a screen shot of what this looks like:
One Health Report to Rule them all. And in the Analytics Light Bind them!
With this report we can now easily monitor the versions of browsers that are hitting your site, and what activity is happening with those browsers. Again, Bounce rates, pages per visit, avg time on page, and conversion rates. Some things that I take into consideration are whether a browser is mobile or desktop, and how that version compares to traffic of other sorts. For my purposes, I see mobile traffic as behaving much different than non-mobile traffic, so it’s important to separate this out so that I can clearly see behavior patterns, and potential problems. I updated my health report into two reports. One for mobile, and another for non-mobile. Using a custom report, we can look at individual browsers and versions, and compare across the board to other versions, and get a picture of areas that we may need to look at or at least test. And as you monitor this on a regular basis, you can decide at what amount of traffic a browser becomes important or non-important. Thus conserving valuable time and money resources
Where did I find 9MM dollars of revenue?
When I monitored the information above, I found an anomaly with a new browser that was being launched. Now initially, the traffic for this browser was not very prolific. In fact, it was not even within our top 90% of traffic. It was concerning that when I ran this report; I noticed that other versions of this browser converted at almost 5x over this new browser version. More importantly, this browser version was a major version, I knew activity with it would grow, and grow fast once it caught on. My first attempts to notify the IT department were ignored, and not seen as important. I have to admit I was a bit frustrated with their lack of understanding and help. What I realized was that they have many, many demands on their time, and projects related to ROI. So I chose to come back to them in a different way.
Speaking with Data - So very Powerful
So, I pulled more data around previous browser launches, modeled the growth pattern that could be expected, and modeled in the conversion rates that I was seeing. This showed a Multi-Million dollar miss if we did not fix this, and it was only going to get worse as time went on. Quite literally, the conversion rates for the new browser were sub 0.1% or lower, when it should have been much higher. My next step was to find out what the problem was, and actually document it fully. That was relatively easy since my report above told me exactly what version I needed to install to discover the problem.
Once I had the documentation prepared, I went to our IT team with data and examples of where and what the problem was. Now, the response was quite different. Instead of an undefined problem, that would require a lot of work to solve, they now had a very defined task to accomplish, and how much potential revenue could be tied to it. The IT team could now look like hero's for solving a Million dollar problem, and I could feel proud that I gave them the information they needed to accomplish what I needed from them. Six months later, I was able to pull actual data showing that the revenue recovered by fixing the problems with this browser version had generated over 9 Million dollars in sales that surely would have been lost without monitoring various health metrics for our website.
Action Items
So what are the action items that you should now work on putting in place at your place of business?
- Download the custom report.
- Copy the custom report, name change "mobile" to "non-mobile" and change the filter for mobile to "No"
- Examine each tab - and start diving for data and places to put corrective action in place.
- If no-one "gets" it, start modelling what it means to not fix the problem vs what it might look like to fix the problem and put a revenue number on it.
Good luck, and I look forward to hearing back from you regarding how you are using my information here to improve your bottom line. So, if you do use this, and it helps, drop me a line and tell me about it! I would love to hear about it.