
Multi-Channel Attribution for an Accurate View of Conversions

Multi-channel attribution has been both widely accepted by marketers and also one of the most difficult results to calculate and prove. The basic premise is that media channels work together synergistically for conversions; some channels get too much credit, and some channels get too little (for example, direct traffic to a website versus organic search traffic).
Direct traffic is usually the largest channel for an established brand and website, but let’s face it: no one wakes up in the morning and suddenly decides to type a domain into their browser. That stimulus comes from some other channel, like display, affiliate, email, paid search, social, PR, content, actual word of mouth, or offline media. Therefore, the direct traffic channel is the largest recipient of unattributed benefit from other channels.
Until recently, calculating the interaction of channels required significant stable data and sophisticated analysis to build a regression model. The output would tell you, for example, that channels A, B and C were undercounted, and D, E, F were being overstated in terms of a “last-click” aka conversion basis.
The analysts would then tell you to redistribute a portion of D, E and F to A, B and C. The cost per acquisition (CPA) of each channel would also be adjusted, and if A, B and C were previously at max CPA, they now could take additional media budget and still generate a return. That would allow the company to correctly increase marketing spend and leads.
The other way to do multi-channel attribution online is by observing the order and interval that consumers interact with and are influenced by the media mix by writing data to the cookie on the user’s browser. Google Analytics provides multi-channel funnel data in the “Conversions” reports section that helps fill in those multi-channel attribution details that you, as a marketer, need. To access, go to GA, then Conversions > Multi-Channel Funnels.
At the overview level (Multi-Channel Funnels > Overview) a Venn diagram illustrates the multi-channel overlap between any two or more of the online channels driving conversions.
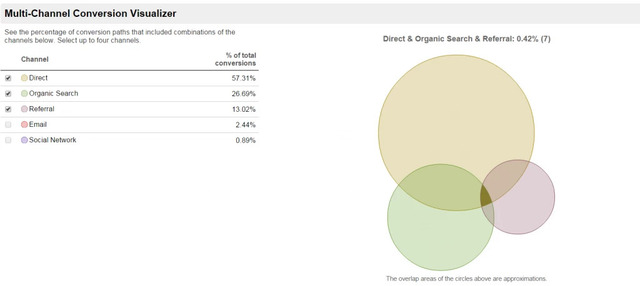
Select the channels for the interaction you want to see. Use your mouse to hover over the circles and overlapping areas and understand the co-influence on conversions.
The “Assisted Conversions” reports section ((Multi-Channel Funnels > Assisted Conversions) shows each channel on a last-click basis and what portion of those conversions are touched by another channel.
For BrightEdge.com, one-third of online channels are assisted by at least one other channel with a range of cross-channel assistance of .29 to .65. Of direct traffic results, half were assisted by another channel and should get a portion of those results.
If email has a .65 assist value, then for every 100 tracked results, you should also attribute 65 more. So, for example, if email results were $9,000/100, that equals a $90 CPA. With assisted multi-channel attribution, it would now look like $9,000/165, which equals a $54 CPA – 40 percent less than it originally appeared.
Since the observational approach relies on browser cookies, it tends to undercount multi-channel attribution over time because cookies are often deleted. Research shows “cookie death” causes additional understatement of contribution by another 35 to 55 percent.
In the case above, on an unattributed basis, email would get credit for 100 conversions, and on an attributed basis and accounting for cookie deletion, it should get credit for 200. The difference between 100 and 200 usually ends up in that catch-all bucket, direct.
To get started with GA’s multi-channel funnel data:
- Make sure your channel managers are adding channel-tracking codes to web marketing assets
- Go to the Multi-Channel Funnels Overview report to visualize your media mix
- Review your Assisted Conversions report and adjust your totals, CPAs, and budgets, if warranted.